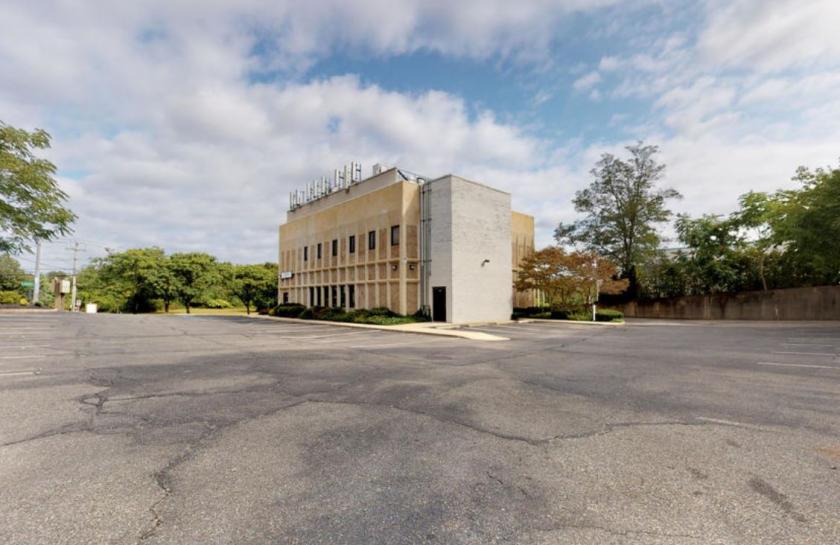
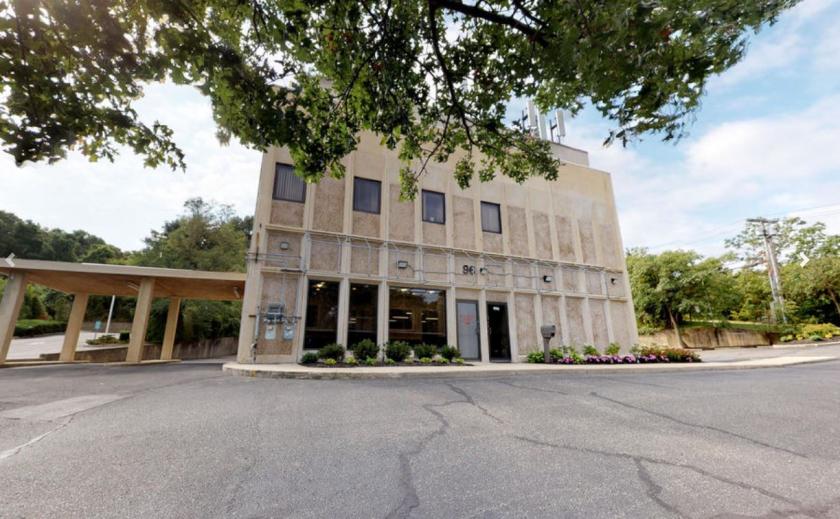
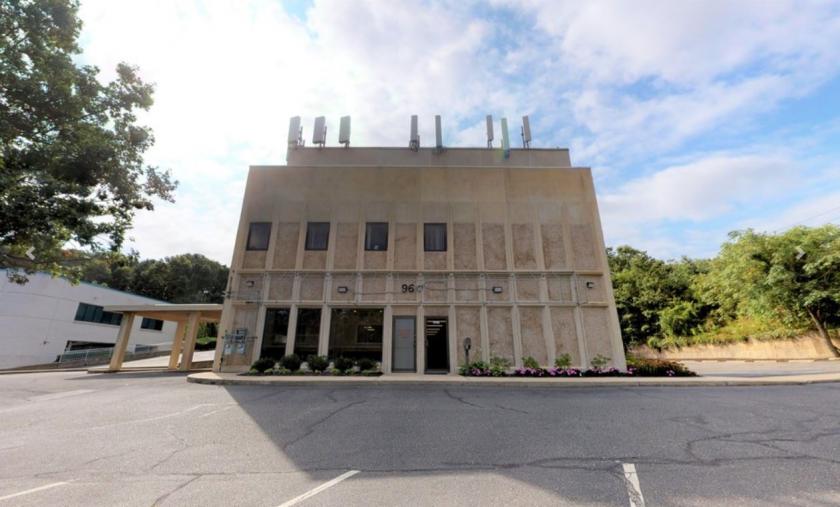
SVN Stora Realty is proud to present this 7054 SF +- Office building for sale at $1,950,000.00 The first floor is available for occupancy and features 3,525 SF office space. The ground floor space includes six existing offices and a large open space in the center. The office also includes two handicap bathrooms, a kitchen area, a storage room, a drive thru window not currently in use, front and rear entrance, and access to 35 parking spots.This office location offers potential tenants a prime opportunity. The office is also surrounded by professional service businesses and medical buildings, and within walking distance to strong local and national retail businesses. Currently occupied by 5 tenants and offers leasing opportunity that would give the business operator the chance to have visible presence on a commuter turnpike in a desirable location.This asset is perfect for an owner/user/investor looking to build equity in a quality asset on Long Islands north shore, while occupying the first floor. Available square feet is 3,525. Existing income for the second floor tenant and cell phone towers give immediate positive cash flow to someone occupying the space.Potential exists to offset the purchase price by selling off the cell tower income.Current monthly rent payments from each tenant include:2nd floor CPA- $5,581.25AT&T- $2,722.26T-Mobile- $2,809.47Sprint- $2,737.58Optimum- $1,048.68Property Taxes are $38,458.20. The 3 cellular companies pay a portion of the annual property taxes at approximately $2,500-$3,000 each, equaling a total of $7,500-$9,000.