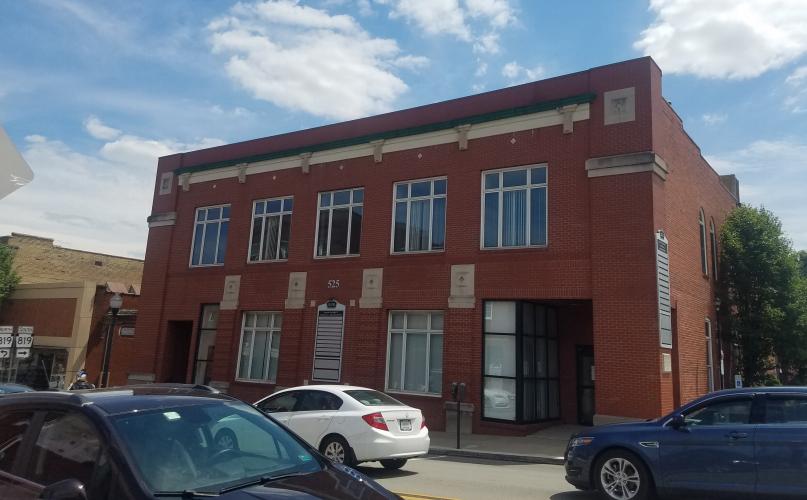
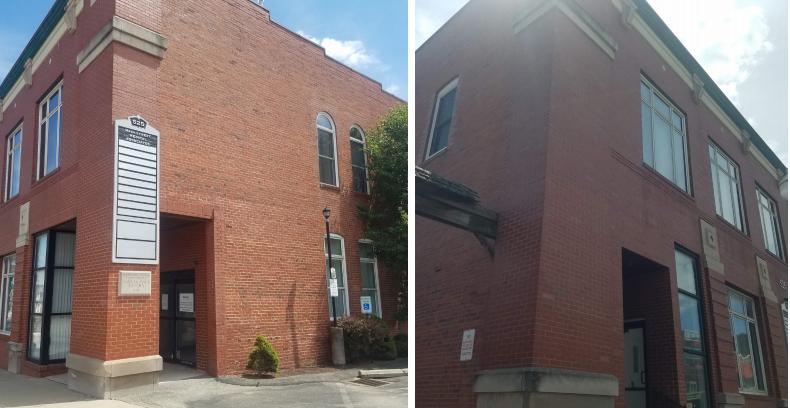
Iconic and stately building in the heart of Mt. Pleasant
16,830 SF renovated office buidling with private parking lot
1st floor built out for ADA compliant medical offices
2nd floor: executive offices
Total building available for lease 16,830 SF - subdividavble to 2,500 SF
Individually zoned HVAC systems; 400amp service
Newer EPDM roof with warranty
Zoned B-1 in Mt. Pleasant-flexible uses
Seller may finance all or a portion of sales price.
Parking lot with 22+ spaces
No part of this information may be copied, reproduced, repurposed, or screen-captured for any commercial purpose without prior written authorization from MyEListing.
While we strive to provide the most accurate information, all listing information, and demographic data, is provided by third-parties. As such, MyEListing will not be responsible for the accuracy of the information. It is strongly recommended that you verify all information with the listing agent, and any relevant agencies, prior to making any decisions.
What is the building size of this commercial Office property?
The size of this multi-unit property varies between 2500 - 16830 square feet
What kind of Office is the propery at 525 West Main Street?
The property at 525 West Main Street Mount Pleasant, PA 15666 is listed as a Medical Office property
What is the population within 1 mile of 525 West Main Street in Mount Pleasant?
The population within 1 mile of 525 West Main Street Mount Pleasant, PA 15666 is 5,063 people.
Who do I contact for questions about 525 West Main Street?
You should contact the listing agent,
Meagan Moore, for any details regarding this commercial listing.