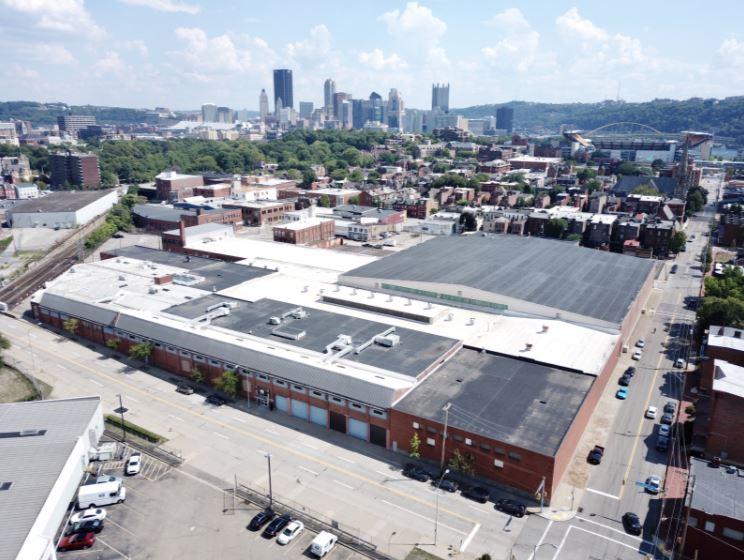
1-Mile | 3-Miles | 5-Miles | ||
---|---|---|---|---|
Total Population | 13,053 | 132,627 | 355,652 | |
Population Median Age | 39 | 38 | 38 | |
Population by Age | 0-9 Yrs | 1148 (8%) | 12103 (9%) | 31457 (8%) |
10-19 Yrs | 1055 (8%) | 14040 (10%) | 38642 (10%) | |
20-29 Yrs | 2928 (22%) | 29524 (22%) | 79377 (22%) | |
30-39 Yrs | 2354 (18%) | 21661 (16%) | 56348 (15%) | |
40-49 Yrs | 1193 (9%) | 12670 (9%) | 34150 (9%) | |
50-59 Yrs | 1657 (12%) | 16564 (12%) | 42112 (11%) | |
60-69 Yrs | 1616 (12%) | 14287 (10%) | 39106 (10%) | |
70+ Yrs | 1102 (8%) | 11779 (8%) | 34462 (9%) | |
Median HH Income | $41,744 | $45,915 | $51,985 | |
Total Household Income | < 24K | 2341 (33%) | 18159 (30%) | 42660 (26%) |
25-49K | 1463 (20%) | 13565 (22%) | 36363 (22%) | |
50-74K | 1037 (14%) | 10020 (16%) | 27766 (17%) | |
75-99K | 796 (11%) | 6474 (10%) | 19867 (12%) | |
100-199K | 1013 (14%) | 9329 (15%) | 28897 (17%) | |
200K+ | 342 (4%) | 2589 (4%) | 7684 (4%) | |
Highest Education Level | No Diploma | 651 | 7920 | 17121 |
Diploma or GED | 2462 | 28459 | 68237 | |
Some College | 1688 | 16933 | 38798 | |
Assoc. Degree | 712 | 8378 | 22800 | |
Bachelors Degree | 2317 | 19236 | 59494 | |
Higher Degree | 1773 | 12397 | 42298 | |
Total Housing Units | 8,249 | 70,433 | 184,994 | |
--Owner-Occupied | 2,465 | 27,820 | 82,554 | |
--Renter-Occupied | 4,526 | 32,318 | 80,684 | |
Owner-Occupied Values | < 100K | 881 | 13131 | 30156 |
100-199K | 577 | 9425 | 32267 | |
200-299K | 432 | 2847 | 10976 | |
300-399K | 324 | 1103 | 4006 | |
400-499K | 126 | 577 | 1874 | |
500K+ | 125 | 737 | 3275 | |
Total Working Age Population | 11,396 | 114,406 | 307,465 | |
In Work Force | 7,763 | 72,234 | 201,022 | |
Not In Work Force | 3,633 | 42,172 | 106,444 | |
Workforce Employed | 7,246 | 67,850 | 190,566 | |
Workforce Unemployed | 512 | 4,332 | 10,260 | |
Civlian Workforce | 7,757 | 72,183 | 200,826 | |
Military Workforce | 6 | 51 | 196 | |
Total Households | 6,992 | 60,138 | 163,238 | |
Family Households | 2,377 | 25,137 | 71,667 | |
Non-Family Households | 4,614 | 35,001 | 91,572 | |
Married Couple | 1,356 | 14,670 | 47,627 | |
Other Family | 1,021 | 10,467 | 24,040 | |
Married w/Child | 334 | 4,341 | 15,699 | |
Single Male w/Child | 64 | 968 | 2,352 | |
Single Female w/Child | 463 | 4,563 | 9,302 |
Population Change Last Two Decades - Plus Projection
2000 | % | 2010 | % | 2020 | % | 2030 | |
---|---|---|---|---|---|---|---|
Pennsylvania | 12,281,054 | +3 | 12,702,379 | +4 | 13,230,170 | +4 | 13,759,594 |
Allegheny County | 1,281,666 | -5 | 1,223,348 | +3 | 1,265,919 | +3 | 1,307,654 |
Washington County | 202,897 | +2 | 207,820 | 0 | 206,942 | 0 | 207,065 |
Total Working Age Population:
Total Households:
Total Working Age Population:
Total Households:
Total Working Age Population:
Total Households: