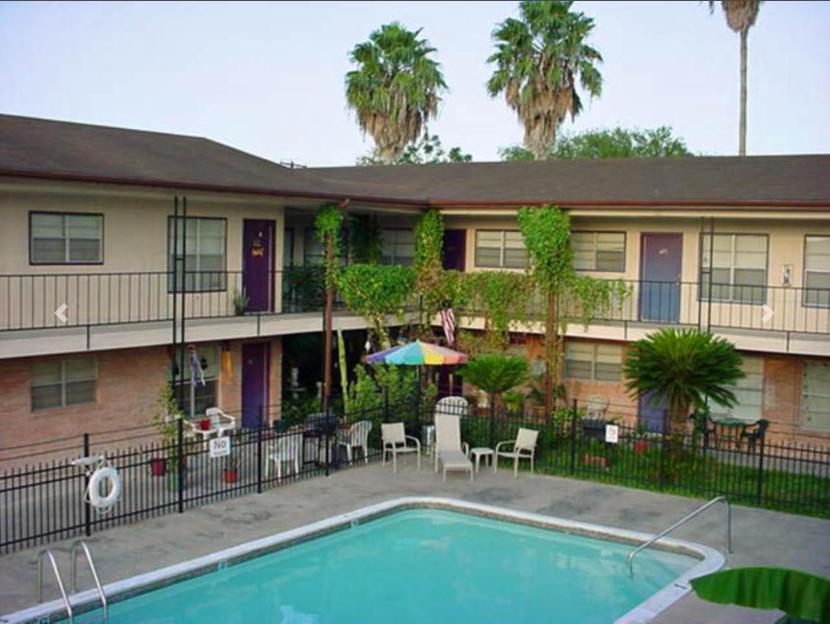
1-Mile | 3-Miles | 5-Miles | ||
---|---|---|---|---|
Total Population | 16,273 | 108,510 | 231,122 | |
Population Median Age | 38 | 36 | 35 | |
Population by Age | 0-9 Yrs | 2084 (12%) | 16824 (15%) | 38429 (16%) |
10-19 Yrs | 2462 (15%) | 15995 (14%) | 36712 (15%) | |
20-29 Yrs | 2377 (14%) | 15627 (14%) | 32197 (13%) | |
30-39 Yrs | 1988 (12%) | 14928 (13%) | 30528 (13%) | |
40-49 Yrs | 2202 (13%) | 13813 (12%) | 29860 (12%) | |
50-59 Yrs | 1654 (10%) | 10332 (9%) | 22168 (9%) | |
60-69 Yrs | 1546 (9%) | 9806 (9%) | 19310 (8%) | |
70+ Yrs | 1960 (12%) | 11185 (10%) | 21918 (9%) | |
Median HH Income | $39,832 | $43,424 | $46,908 | |
Total Household Income | < 24K | 2135 (37%) | 11330 (31%) | 21003 (28%) |
25-49K | 1152 (20%) | 8290 (23%) | 17122 (23%) | |
50-74K | 892 (15%) | 5568 (15%) | 11712 (16%) | |
75-99K | 606 (10%) | 3604 (10%) | 7220 (9%) | |
100-199K | 770 (13%) | 5706 (15%) | 12182 (16%) | |
200K+ | 146 (2%) | 1499 (4%) | 3388 (4%) | |
Highest Education Level | No Diploma | 2952 | 16556 | 34218 |
Diploma or GED | 2473 | 14156 | 29795 | |
Some College | 2140 | 13391 | 28136 | |
Assoc. Degree | 533 | 4599 | 8575 | |
Bachelors Degree | 1635 | 13465 | 26667 | |
Higher Degree | 862 | 5970 | 12405 | |
Total Housing Units | 6,440 | 40,944 | 83,571 | |
--Owner-Occupied | 3,081 | 19,921 | 44,585 | |
--Renter-Occupied | 2,620 | 16,076 | 28,042 | |
Owner-Occupied Values | < 100K | 1462 | 7856 | 18117 |
100-199K | 1403 | 8342 | 17868 | |
200-299K | 135 | 2371 | 5414 | |
300-399K | 43 | 738 | 1611 | |
400-499K | 6 | 250 | 669 | |
500K+ | 31 | 365 | 906 | |
Total Working Age Population | 12,885 | 82,158 | 170,120 | |
In Work Force | 7,945 | 50,437 | 103,616 | |
Not In Work Force | 4,940 | 31,722 | 66,504 | |
Workforce Employed | 7,513 | 47,297 | 97,273 | |
Workforce Unemployed | 432 | 3,108 | 6,165 | |
Civlian Workforce | 7,945 | 50,405 | 103,438 | |
Military Workforce | 0 | 32 | 177 | |
Total Households | 5,701 | 35,998 | 72,627 | |
Family Households | 3,996 | 26,174 | 55,487 | |
Non-Family Households | 1,705 | 9,823 | 17,140 | |
Married Couple | 2,406 | 16,578 | 36,283 | |
Other Family | 1,590 | 9,596 | 19,204 | |
Married w/Child | 956 | 7,435 | 17,550 | |
Single Male w/Child | 89 | 703 | 1,505 | |
Single Female w/Child | 542 | 3,999 | 8,348 |
Population Change Last Two Decades - Plus Projection
2000 | % | 2010 | % | 2020 | % | 2030 | |
---|---|---|---|---|---|---|---|
Texas | 20,851,820 | +21 | 25,145,561 | +18 | 29,677,668 | +18 | 34,894,452 |
Hidalgo County | 569,463 | +36 | 774,769 | +12 | 870,366 | +10 | 956,044 |
Total Working Age Population:
Total Households:
Total Working Age Population:
Total Households:
Total Working Age Population:
Total Households: