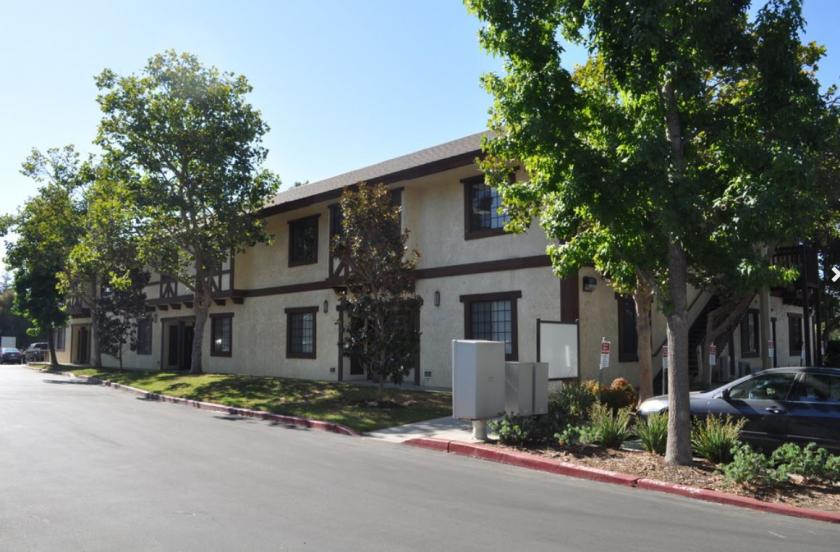
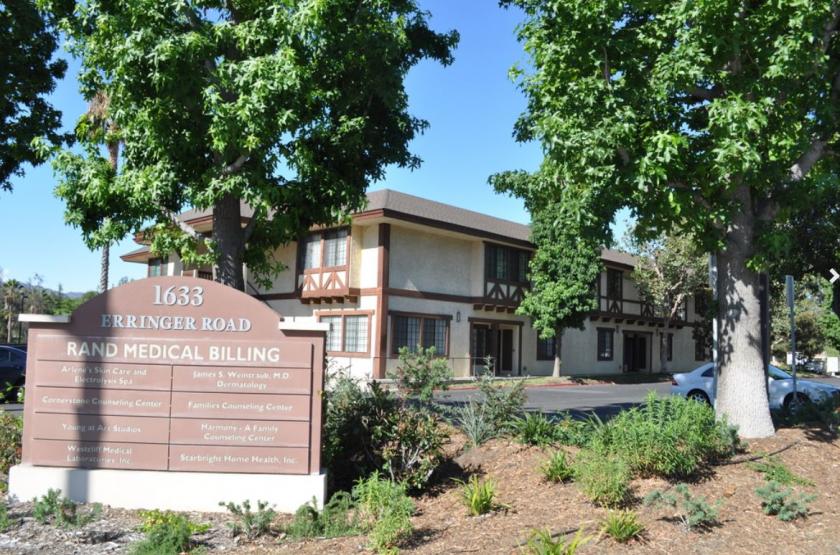
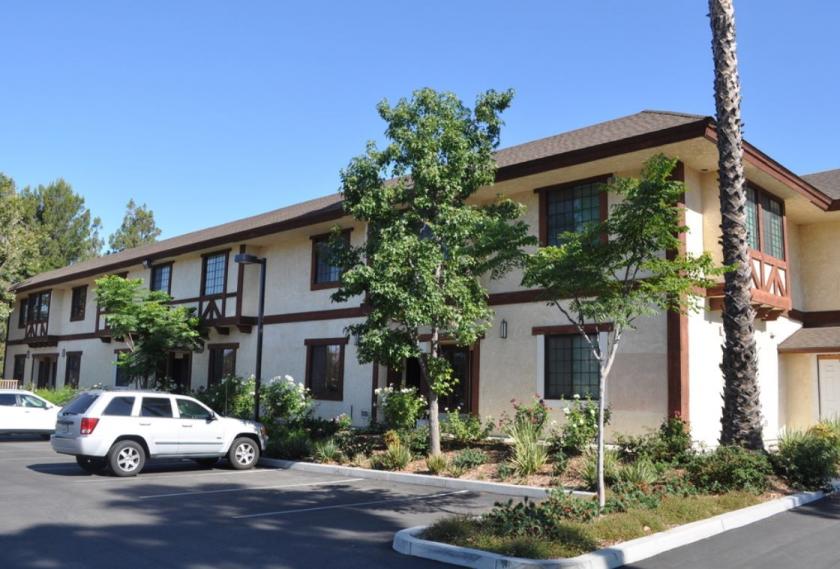
1-Mile | 3-Miles | 5-Miles | ||
---|---|---|---|---|
Total Population | 23,913 | 79,797 | 126,743 | |
Population Median Age | 37 | 39 | 40 | |
Population by Age | 0-9 Yrs | 2979 (12%) | 8861 (11%) | 13511 (10%) |
10-19 Yrs | 3363 (14%) | 10737 (13%) | 17161 (13%) | |
20-29 Yrs | 3350 (14%) | 11010 (13%) | 16302 (12%) | |
30-39 Yrs | 3550 (14%) | 9925 (12%) | 15217 (12%) | |
40-49 Yrs | 3119 (13%) | 11098 (13%) | 17602 (13%) | |
50-59 Yrs | 3769 (15%) | 12330 (15%) | 19962 (15%) | |
60-69 Yrs | 2000 (8%) | 8430 (10%) | 14661 (11%) | |
70+ Yrs | 1782 (7%) | 7405 (9%) | 12327 (9%) | |
Median HH Income | $90,190 | $97,494 | $101,681 | |
Total Household Income | < 24K | 750 (10%) | 2338 (9%) | 3837 (9%) |
25-49K | 1002 (14%) | 3466 (13%) | 5423 (12%) | |
50-74K | 1074 (15%) | 3638 (14%) | 5569 (13%) | |
75-99K | 1231 (17%) | 3915 (15%) | 5887 (13%) | |
100-199K | 2437 (34%) | 9039 (34%) | 14881 (35%) | |
200K+ | 654 (9%) | 3534 (13%) | 6501 (15%) | |
Highest Education Level | No Diploma | 2277 | 5060 | 6989 |
Diploma or GED | 3963 | 12427 | 18407 | |
Some College | 4165 | 14024 | 21728 | |
Assoc. Degree | 1676 | 6237 | 9744 | |
Bachelors Degree | 2740 | 11505 | 20576 | |
Higher Degree | 1251 | 5590 | 10620 | |
Total Housing Units | 7,350 | 26,789 | 43,658 | |
--Owner-Occupied | 4,830 | 19,185 | 30,782 | |
--Renter-Occupied | 2,318 | 6,747 | 11,315 | |
Owner-Occupied Values | < 100K | 64 | 306 | 524 |
100-199K | 51 | 175 | 379 | |
200-299K | 200 | 563 | 908 | |
300-399K | 521 | 1494 | 2022 | |
400-499K | 1430 | 4095 | 5787 | |
500K+ | 2564 | 12552 | 21162 | |
Total Working Age Population | 18,838 | 64,407 | 102,886 | |
In Work Force | 13,039 | 43,914 | 69,108 | |
Not In Work Force | 5,799 | 20,493 | 33,778 | |
Workforce Employed | 12,370 | 41,882 | 65,845 | |
Workforce Unemployed | 667 | 2,026 | 3,243 | |
Civlian Workforce | 13,037 | 43,908 | 69,088 | |
Military Workforce | 3 | 6 | 20 | |
Total Households | 7,148 | 25,932 | 42,097 | |
Family Households | 5,357 | 19,251 | 31,071 | |
Non-Family Households | 1,791 | 6,681 | 11,026 | |
Married Couple | 3,830 | 14,507 | 24,195 | |
Other Family | 1,527 | 4,744 | 6,876 | |
Married w/Child | 1,744 | 6,114 | 10,058 | |
Single Male w/Child | 223 | 602 | 809 | |
Single Female w/Child | 491 | 1,354 | 1,906 |
Population Change Last Two Decades - Plus Projection
2000 | % | 2010 | % | 2020 | % | 2030 | |
---|---|---|---|---|---|---|---|
California | 33,871,648 | +10 | 37,253,956 | +9 | 40,467,295 | +8 | 43,631,295 |
Los Angeles County | 9,519,338 | +3 | 9,818,605 | +6 | 10,369,367 | +4 | 10,759,850 |
Ventura County | 753,197 | +9 | 823,318 | +5 | 863,528 | +5 | 909,779 |
Total Working Age Population:
Total Households:
Total Working Age Population:
Total Households:
Total Working Age Population:
Total Households: