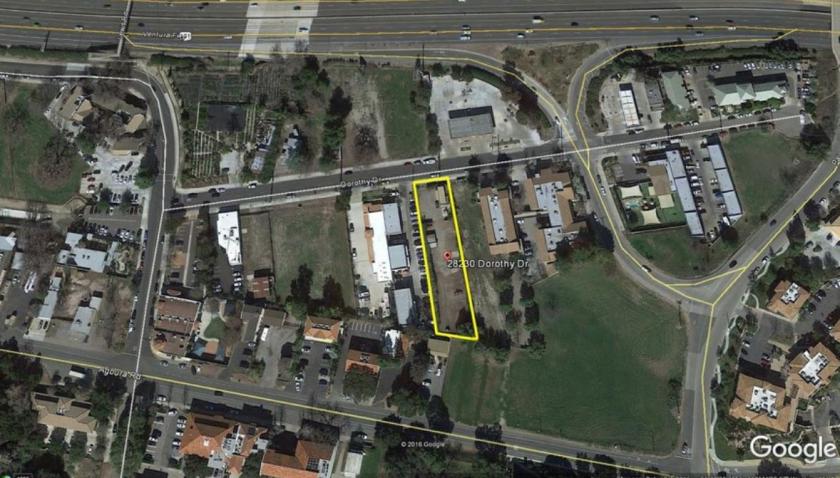
1-Mile | 3-Miles | 5-Miles | ||
---|---|---|---|---|
Total Population | 4,642 | 36,620 | 69,583 | |
Population Median Age | 40 | 41 | 42 | |
Population by Age | 0-9 Yrs | 489 (10%) | 3915 (10%) | 7448 (10%) |
10-19 Yrs | 440 (9%) | 4663 (12%) | 9189 (13%) | |
20-29 Yrs | 561 (12%) | 4222 (11%) | 6668 (9%) | |
30-39 Yrs | 867 (18%) | 4174 (11%) | 7263 (10%) | |
40-49 Yrs | 599 (12%) | 5178 (14%) | 9677 (13%) | |
50-59 Yrs | 846 (18%) | 5841 (15%) | 11165 (16%) | |
60-69 Yrs | 363 (7%) | 4912 (13%) | 10186 (14%) | |
70+ Yrs | 478 (10%) | 3715 (10%) | 7986 (11%) | |
Median HH Income | $93,531 | $118,259 | $123,414 | |
Total Household Income | < 24K | 184 (10%) | 1150 (8%) | 2145 (8%) |
25-49K | 304 (16%) | 1479 (10%) | 2629 (10%) | |
50-74K | 264 (14%) | 1615 (12%) | 2756 (10%) | |
75-99K | 226 (12%) | 1455 (10%) | 2793 (10%) | |
100-199K | 567 (30%) | 4047 (30%) | 8205 (31%) | |
200K+ | 293 (15%) | 3711 (27%) | 7447 (28%) | |
Highest Education Level | No Diploma | 105 | 643 | 1179 |
Diploma or GED | 573 | 3025 | 5556 | |
Some College | 706 | 4582 | 8814 | |
Assoc. Degree | 359 | 1916 | 3568 | |
Bachelors Degree | 1096 | 9298 | 17527 | |
Higher Degree | 572 | 6106 | 12444 | |
Total Housing Units | 2,021 | 14,093 | 27,227 | |
--Owner-Occupied | 1,004 | 9,748 | 19,318 | |
--Renter-Occupied | 834 | 3,709 | 6,657 | |
Owner-Occupied Values | < 100K | 27 | 135 | 278 |
100-199K | 0 | 96 | 199 | |
200-299K | 29 | 173 | 329 | |
300-399K | 177 | 468 | 810 | |
400-499K | 166 | 787 | 1527 | |
500K+ | 605 | 8090 | 16173 | |
Total Working Age Population | 3,910 | 29,774 | 56,348 | |
In Work Force | 2,678 | 19,717 | 35,867 | |
Not In Work Force | 1,232 | 10,057 | 20,481 | |
Workforce Employed | 2,512 | 18,830 | 34,305 | |
Workforce Unemployed | 166 | 874 | 1,547 | |
Civlian Workforce | 2,678 | 19,704 | 35,852 | |
Military Workforce | 0 | 13 | 15 | |
Total Households | 1,837 | 13,458 | 25,975 | |
Family Households | 1,135 | 9,623 | 18,441 | |
Non-Family Households | 703 | 3,835 | 7,534 | |
Married Couple | 898 | 7,946 | 15,483 | |
Other Family | 237 | 1,677 | 2,958 | |
Married w/Child | 398 | 3,178 | 6,493 | |
Single Male w/Child | 52 | 351 | 471 | |
Single Female w/Child | 48 | 554 | 970 |
Population Change Last Two Decades - Plus Projection
2000 | % | 2010 | % | 2020 | % | 2030 | |
---|---|---|---|---|---|---|---|
California | 33,871,648 | +10 | 37,253,956 | +9 | 40,467,295 | +8 | 43,631,295 |
Los Angeles County | 9,519,338 | +3 | 9,818,605 | +6 | 10,369,367 | +4 | 10,759,850 |
Ventura County | 753,197 | +9 | 823,318 | +5 | 863,528 | +5 | 909,779 |
Total Working Age Population:
Total Households:
Total Working Age Population:
Total Households:
Total Working Age Population:
Total Households: