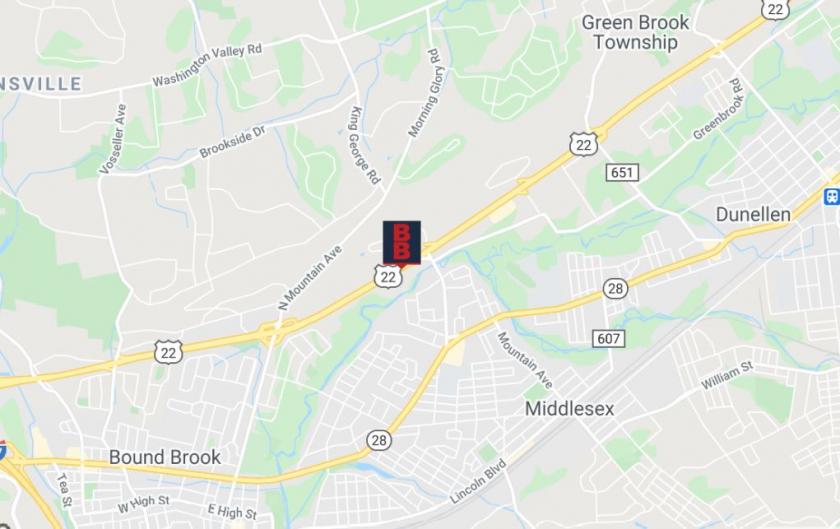
1-Mile | 3-Miles | 5-Miles | ||
---|---|---|---|---|
Total Population | 8,127 | 70,704 | 175,783 | |
Population Median Age | 40 | 39 | 39 | |
Population by Age | 0-9 Yrs | 818 (10%) | 8701 (12%) | 21142 (12%) |
10-19 Yrs | 1410 (17%) | 9096 (12%) | 22202 (12%) | |
20-29 Yrs | 897 (11%) | 8257 (11%) | 23464 (13%) | |
30-39 Yrs | 854 (10%) | 10038 (14%) | 24516 (13%) | |
40-49 Yrs | 1039 (12%) | 9509 (13%) | 22837 (12%) | |
50-59 Yrs | 1346 (16%) | 10941 (15%) | 25446 (14%) | |
60-69 Yrs | 873 (10%) | 7580 (10%) | 18792 (10%) | |
70+ Yrs | 890 (10%) | 6582 (9%) | 17386 (9%) | |
Median HH Income | $90,664 | $93,500 | $90,627 | |
Total Household Income | < 24K | 215 (7%) | 2266 (9%) | 6603 (11%) |
25-49K | 561 (20%) | 3629 (14%) | 9258 (15%) | |
50-74K | 409 (14%) | 3991 (16%) | 9284 (15%) | |
75-99K | 326 (11%) | 3155 (12%) | 7531 (12%) | |
100-199K | 774 (27%) | 7463 (30%) | 18203 (30%) | |
200K+ | 494 (17%) | 3938 (16%) | 8827 (14%) | |
Highest Education Level | No Diploma | 497 | 4212 | 11171 |
Diploma or GED | 1560 | 13644 | 32603 | |
Some College | 1037 | 8378 | 20019 | |
Assoc. Degree | 394 | 3287 | 7507 | |
Bachelors Degree | 1092 | 11755 | 28817 | |
Higher Degree | 893 | 7719 | 19987 | |
Total Housing Units | 2,879 | 26,345 | 64,365 | |
--Owner-Occupied | 2,181 | 17,057 | 40,705 | |
--Renter-Occupied | 600 | 7,385 | 19,002 | |
Owner-Occupied Values | < 100K | 23 | 267 | 760 |
100-199K | 61 | 802 | 2420 | |
200-299K | 570 | 5404 | 12359 | |
300-399K | 684 | 4829 | 10902 | |
400-499K | 295 | 1869 | 5062 | |
500K+ | 548 | 3886 | 9203 | |
Total Working Age Population | 6,545 | 56,161 | 141,490 | |
In Work Force | 4,308 | 39,770 | 95,245 | |
Not In Work Force | 2,237 | 16,391 | 46,245 | |
Workforce Employed | 4,203 | 38,032 | 90,215 | |
Workforce Unemployed | 105 | 1,738 | 5,028 | |
Civlian Workforce | 4,308 | 39,770 | 95,243 | |
Military Workforce | 0 | 0 | 2 | |
Total Households | 2,780 | 24,442 | 59,707 | |
Family Households | 2,047 | 18,583 | 44,167 | |
Non-Family Households | 734 | 5,859 | 15,540 | |
Married Couple | 1,603 | 14,078 | 33,417 | |
Other Family | 443 | 4,505 | 10,750 | |
Married w/Child | 731 | 6,028 | 14,246 | |
Single Male w/Child | 58 | 671 | 1,513 | |
Single Female w/Child | 96 | 1,222 | 3,025 |
Population Change Last Two Decades - Plus Projection
2000 | % | 2010 | % | 2020 | % | 2030 | |
---|---|---|---|---|---|---|---|
New Jersey | 8,414,350 | +4 | 8,791,894 | +4 | 9,132,700 | +4 | 9,530,900 |
Middlesex County | 750,162 | +8 | 809,858 | +8 | 873,400 | +7 | 932,200 |
Monmouth County | 615,301 | +2 | 630,380 | 0 | 633,400 | +3 | 655,300 |
Morris County | 470,212 | +5 | 492,276 | +3 | 509,100 | +5 | 535,600 |
Somerset County | 297,490 | +9 | 323,444 | +6 | 342,900 | +7 | 366,700 |
Union County | 522,541 | +3 | 536,499 | +7 | 573,000 | +6 | 605,600 |
Total Working Age Population:
Total Households:
Total Working Age Population:
Total Households:
Total Working Age Population:
Total Households: