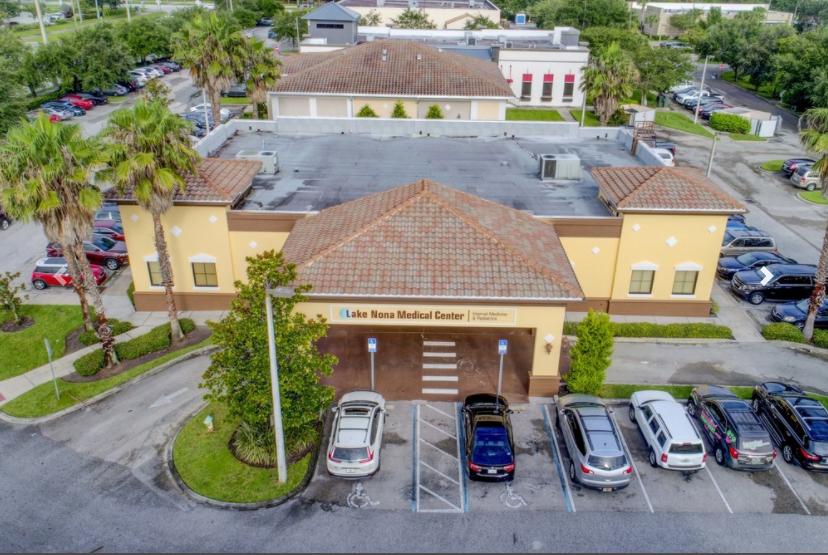
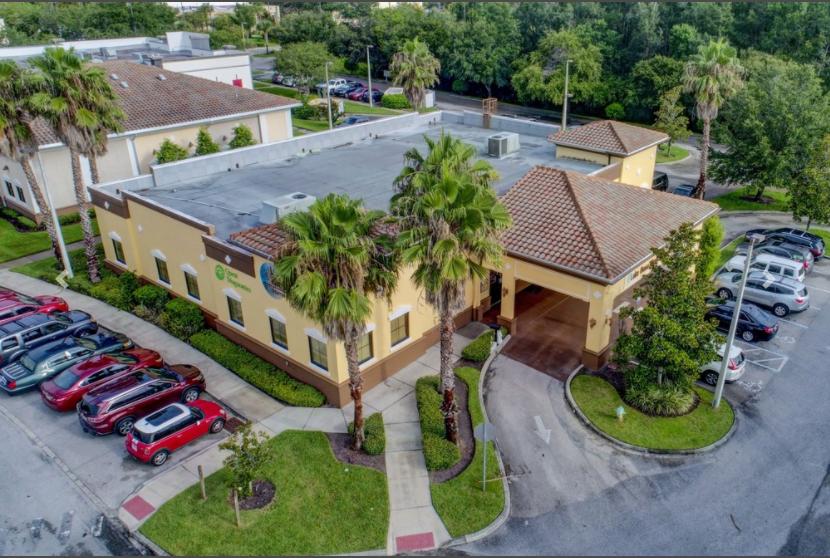
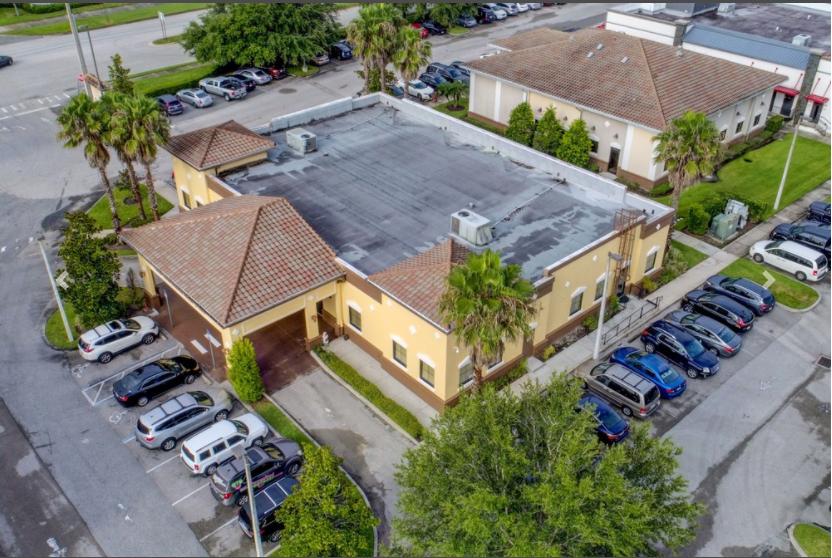
1-Mile | 3-Miles | 5-Miles | ||
---|---|---|---|---|
Total Population | 708 | 9,055 | 43,789 | |
Population Median Age | 35 | 35 | 36 | |
Population by Age | 0-9 Yrs | 100 (14%) | 1314 (14%) | 6021 (13%) |
10-19 Yrs | 111 (15%) | 1346 (14%) | 5958 (13%) | |
20-29 Yrs | 91 (12%) | 1055 (11%) | 5467 (12%) | |
30-39 Yrs | 114 (16%) | 1642 (18%) | 7986 (18%) | |
40-49 Yrs | 120 (16%) | 1393 (15%) | 6563 (14%) | |
50-59 Yrs | 81 (11%) | 1076 (11%) | 5132 (11%) | |
60-69 Yrs | 55 (7%) | 718 (7%) | 3741 (8%) | |
70+ Yrs | 37 (5%) | 510 (5%) | 2922 (6%) | |
Median HH Income | $100,620 | $91,351 | $74,671 | |
Total Household Income | < 24K | 19 (7%) | 246 (8%) | 1762 (12%) |
25-49K | 32 (13%) | 518 (17%) | 3096 (21%) | |
50-74K | 35 (14%) | 433 (14%) | 2514 (17%) | |
75-99K | 32 (13%) | 451 (15%) | 2289 (15%) | |
100-199K | 85 (35%) | 952 (31%) | 3802 (25%) | |
200K+ | 35 (14%) | 384 (12%) | 1214 (8%) | |
Highest Education Level | No Diploma | 21 | 346 | 2262 |
Diploma or GED | 46 | 931 | 5959 | |
Some College | 74 | 955 | 5017 | |
Assoc. Degree | 41 | 583 | 3453 | |
Bachelors Degree | 169 | 1927 | 8006 | |
Higher Degree | 107 | 1194 | 4701 | |
Total Housing Units | 303 | 3,748 | 17,795 | |
--Owner-Occupied | 152 | 1,952 | 9,079 | |
--Renter-Occupied | 87 | 1,032 | 5,598 | |
Owner-Occupied Values | < 100K | 1 | 41 | 682 |
100-199K | 5 | 237 | 1783 | |
200-299K | 46 | 587 | 2908 | |
300-399K | 48 | 557 | 2204 | |
400-499K | 25 | 286 | 875 | |
500K+ | 26 | 244 | 627 | |
Total Working Age Population | 533 | 6,801 | 33,630 | |
In Work Force | 361 | 4,694 | 23,394 | |
Not In Work Force | 173 | 2,107 | 10,236 | |
Workforce Employed | 351 | 4,556 | 22,605 | |
Workforce Unemployed | 8 | 131 | 765 | |
Civlian Workforce | 360 | 4,687 | 23,370 | |
Military Workforce | 1 | 8 | 24 | |
Total Households | 240 | 2,984 | 14,677 | |
Family Households | 180 | 2,275 | 10,784 | |
Non-Family Households | 59 | 709 | 3,892 | |
Married Couple | 146 | 1,809 | 8,234 | |
Other Family | 35 | 466 | 2,550 | |
Married w/Child | 75 | 920 | 3,990 | |
Single Male w/Child | 4 | 59 | 282 | |
Single Female w/Child | 18 | 236 | 1,242 |
Population Change Last Two Decades - Plus Projection
2000 | % | 2010 | % | 2020 | % | 2030 | |
---|---|---|---|---|---|---|---|
Florida | 15,982,378 | +18 | 18,801,310 | +14 | 21,517,610 | +13 | 24,340,457 |
Orange County | 896,344 | +28 | 1,145,956 | +24 | 1,415,511 | +20 | 1,693,977 |
Osceola County | 172,493 | +56 | 268,685 | +42 | 380,703 | +31 | 500,204 |
Polk County | 483,924 | +24 | 602,095 | +16 | 699,589 | +15 | 807,917 |
Total Working Age Population:
Total Households:
Total Working Age Population:
Total Households:
Total Working Age Population:
Total Households: