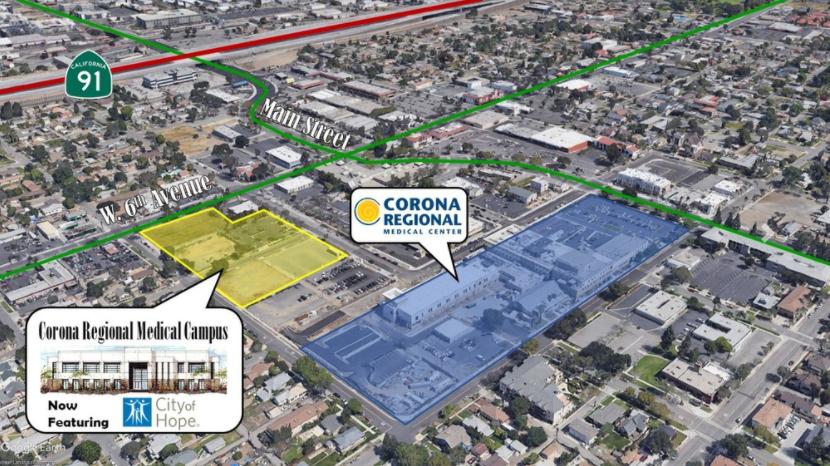
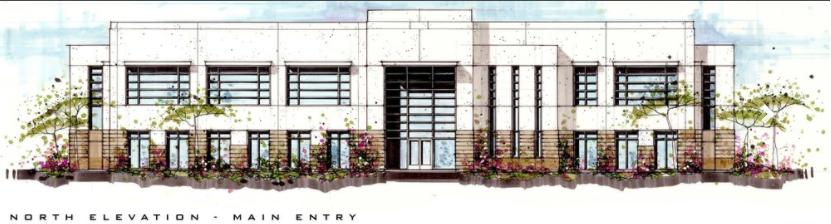
On behalf of the Boureston Companies, SVN | Insight is pleased to present the Corona Regional Medical Campus, the most anticipated medical office project in western Riverside County. These new facilities will supply an additional 60,000 square feet of high-image, Class A medical space directly adjacent to Corona’s local community hospital, Corona Regional Medical Center. Located in the heart of Downtown Corona, the project ensures quality healthcare providers remain accessible to a growing population where demand medical services and household incomes are on the rise.
Highlights
New 'Class A' Construction Designed Exclusively For Medical
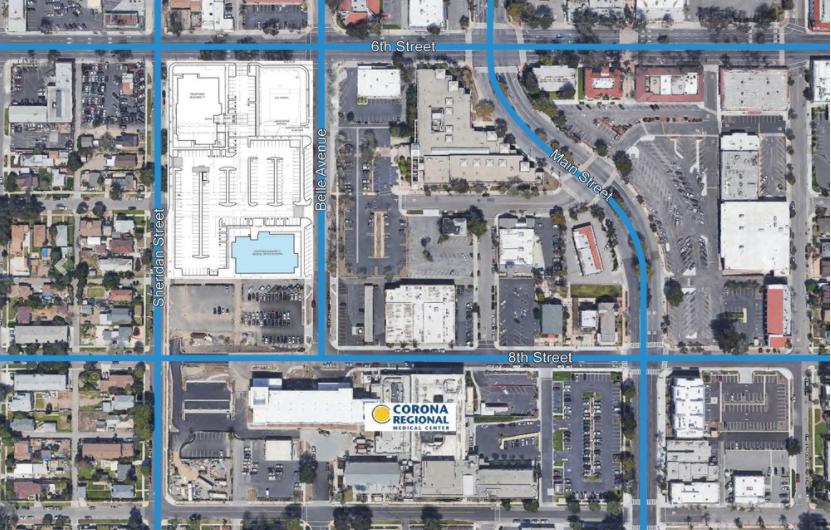
Located In The Heart of Corona's Downtown Core
Directly Adjacent To Corona's 160-Bed Acute Care Hospital
Abundant Parking - 5 Spaces Per 1,000 NLA
Elevator Served
Professionally Managed
Convenient Access To Major Freeways
No part of this information may be copied, reproduced, repurposed, or screen-captured for any commercial purpose without prior written authorization from MyEListing.
While we strive to provide the most accurate information, all listing information, and demographic data, is provided by third-parties. As such, MyEListing will not be responsible for the accuracy of the information. It is strongly recommended that you verify all information with the listing agent, and any relevant agencies, prior to making any decisions.
What is the asking price for 308 West 6th Street in Corona?
The asking price for 308 West 6th Street is $0.02 - $28.20 a SF per Year
What is the building size of this commercial Office property?
The size of this multi-unit property varies between 1500 - 7235 square feet
What kind of Office is the propery at 308 West 6th Street?
The property at 308 West 6th Street Corona, CA 92882 is listed as a Medical Office property
What is the population within 1 mile of 308 West 6th Street in Corona?
The population within 1 mile of 308 West 6th Street Corona, CA 92882 is 22,782 people.
Who do I contact for questions about 308 West 6th Street?
You should contact the listing agent,
Brett Larson, for any details regarding this commercial listing.