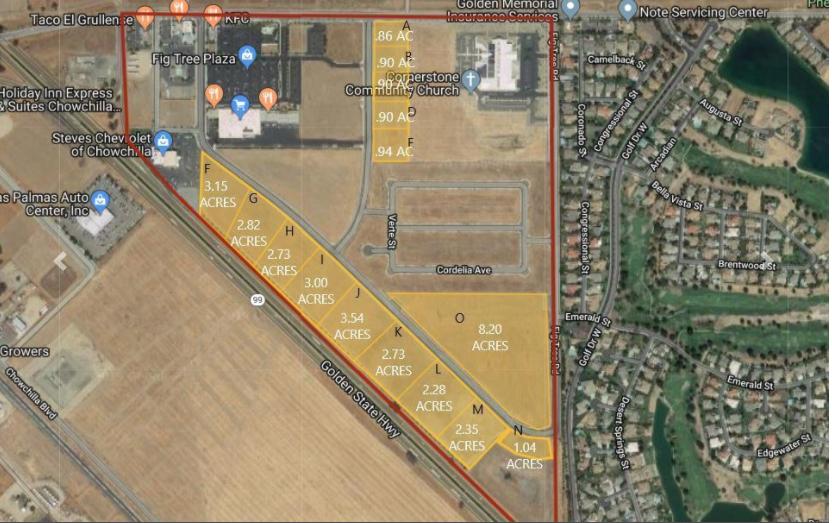
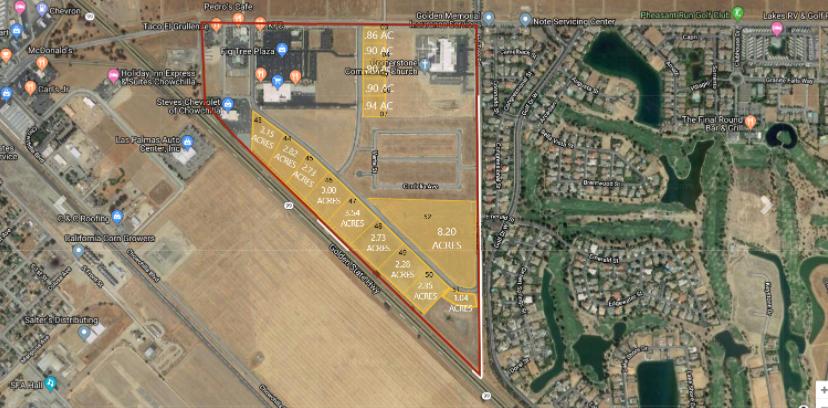
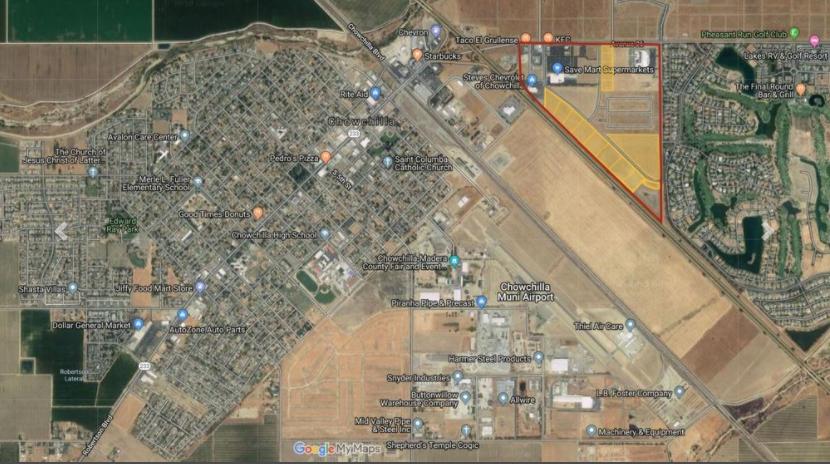
15 Finished Commercial Lots For Sale. Located next to Chowchilla's largest grocery center with easy freeway on/off access. Great place to build a hotel, truck stop, multi units, car lots, etc.. Surrounded by: Pheasant Run Golf Club, KFC, Taco Bell, Perko's Cafe, Little Caesar's, Cross-fit Chowchilla and Deli Delicious.
Located within the boundaries of an Opportunity Zone
This federal program provides tax benefits to significant portions of Chowchilla's industrial park by reducing capital gains taxes based on the length of investment, and deferment on taxes owed.
CHOWCHILLA BUSINESS INCENTIVES
• Retail and Commercial Incentives
• Waiver of building permit fees for Downtown construction projects.
• Development impact fees deferred until a certificate of occupancy is issued.
• Infill Program: Waiver of all development impact fees when building on a vacant lot located in Chowchilla, west of the Union Pacific Railroad tracks.
• Impact Fee Waiver: Waiver of sewer and water development impact fees for commercial development.
• Rebate of 50% of the City's sales tax for up to three years when occupying or expanding into a vacant building.
Highlights
Along Highway 99
Opportunity Zone
Incentives for Development
Lots ready to build on
Utilities are located at the site
Behind Fig Tree Plaza Shopping Center
South of Steves Chevrolet
Near the Pheasant Run Golf Club