- Suite 201: 2,527 RSF / Lease Rate: $2,316/Month
- Fiber Available
- Monument Signage Available
- Total Building: 12,566 RSF
- Easy Access to I-15, I-215
- Adjacent to TOSH (The Orthopedic Specialty Hospital)
- Close Proximity to IMC Hospital
Lease Rate : $11.00/SF NNN
- Full Service Rates Available -
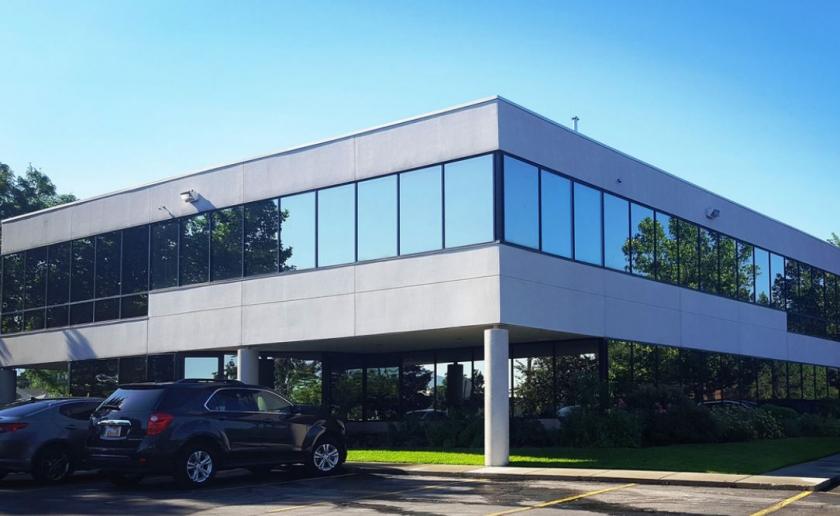
279 East 5900 South, Murray 84107
For more information on this property, please contact Kellen Koncar and Daneile Snelling at 801.617.1700 or by email at kellen.koncar@crcnationwide.com and daneile.snelling@crcnationwide.com. Kellen and Daneile and are licensed real estate agents in the state of Utah and are affiliated with cRc Nationwide Real Estate Brokerage.
No part of this information may be copied, reproduced, repurposed, or screen-captured for any commercial purpose without prior written authorization from MyEListing.
While we strive to provide the most accurate information, all listing information, and demographic data, is provided by third-parties. As such, MyEListing will not be responsible for the accuracy of the information. It is strongly recommended that you verify all information with the listing agent, and any relevant agencies, prior to making any decisions.
What is the asking price for 279 East 5900 South in Murray?
The asking price for 279 East 5900 South is $
What is the building size of this commercial Office property?
The size of this lease property at '.279 East 5900 South.' is 2527 square feet
What kind of Office is the propery at 279 East 5900 South?
The property at 279 East 5900 South Murray, UT 84107 is listed as a Professional Office property
What is the population within 1 mile of 279 East 5900 South in Murray?
The population within 1 mile of 279 East 5900 South Murray, UT 84107 is 12,514 people.
Who do I contact for questions about 279 East 5900 South?
You should contact the listing agent,
Kellen Koncar, for any details regarding this commercial listing.