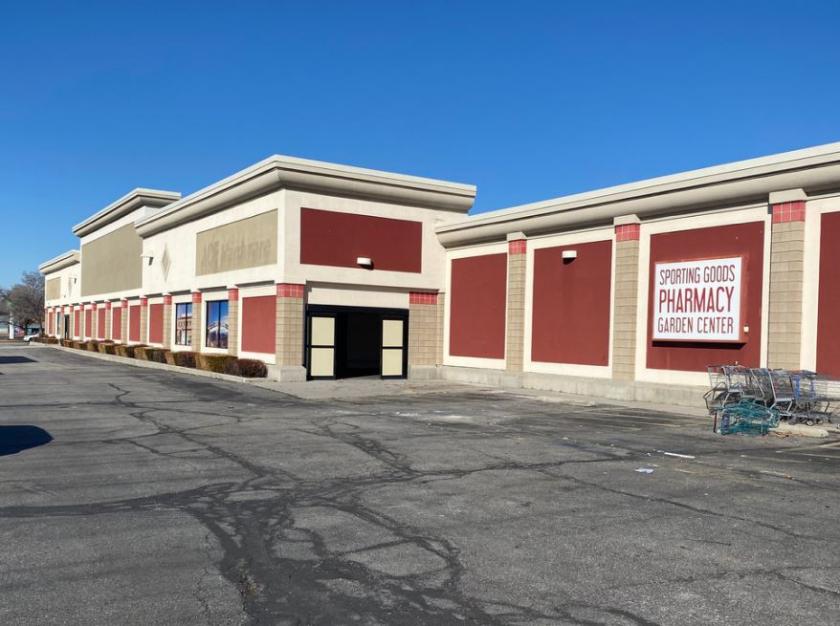
- (3) Retail Buildings Totaling ±66,255 SF
±52,124 SF Main Building
5,036 SF Multi Tenant Strip
9,095 SF Multi Tenant Strip
- Zoned CP-3; Possible Multi Family Use
- Site Size: 5.61 Acres
- Excellent Opportunity for Investment or Development
- Located on a Corner Signalized Intersection
- Seller Financing Available
(contact agents for rent roll details)
- Sale Price: $5,500,000.00
120 N. Washington Blvd., Ogden, Utah 84404
For more information on this property, please contact West Haradin or Crystal Johnson at 801.617.1700 or by email at west.haradin@crcnationwide.com, crystal.johnson@crcnationwide. West and Crystal are licensed real estate agents in the state of Utah and are affiliated with cRc Nationwide Real Estate Brokerage.
No part of this information may be copied, reproduced, repurposed, or screen-captured for any commercial purpose without prior written authorization from MyEListing.
While we strive to provide the most accurate information, all listing information, and demographic data, is provided by third-parties. As such, MyEListing will not be responsible for the accuracy of the information. It is strongly recommended that you verify all information with the listing agent, and any relevant agencies, prior to making any decisions.
What is the asking price for 120 North Washington Boulevard in Ogden?
The asking price for 120 North Washington Boulevard is $5,500,000
What is the building size of this Retail property in Ogden, UT?
The size of the building/unit at 120 North Washington Boulevard in Ogden is 66,255 square feet
How much land does the Ogden, UT property at 120 North Washington Boulevard include?
120 North Washington Boulevard in Ogden includes 5.610 acres of land
What kind of Retail is the propery at 120 North Washington Boulevard?
The property at 120 North Washington Boulevard Ogden, UT 84404 is listed as a Shopping Center Retail property
What is the population within 1 mile of 120 North Washington Boulevard in Ogden?
The population within 1 mile of 120 North Washington Boulevard Ogden, UT 84404 is 15,532 people.
Who do I contact for questions about 120 North Washington Boulevard?
You should contact the listing agent,
West Haradin, for any details regarding this commercial listing.