Retail Space
65 West 800 North Orem, UT 84057
65 West 800 North Orem, UT 84057
Details & Description
Property Highlights
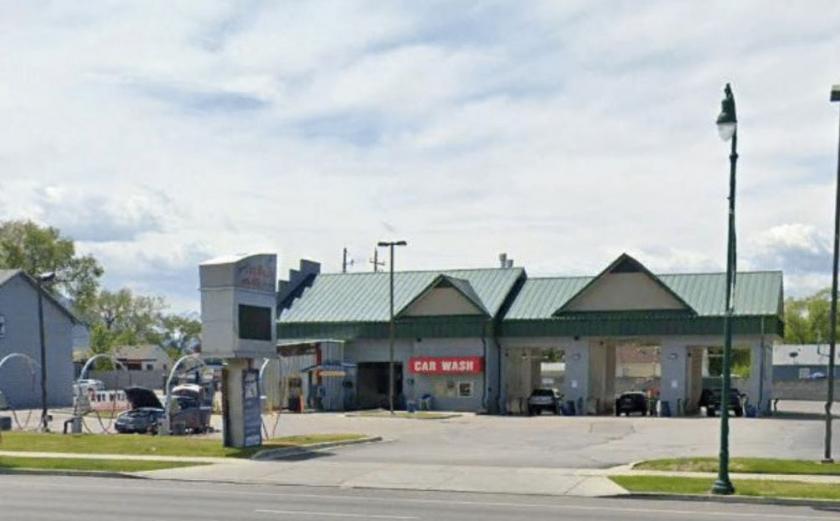
• Orem Car Wash for Sale
• Orem Car Wash for Sale
Listing Agents

Sam Christensen
O: 801-617-1700
sam.christensen@crcnationwide.com
O: 801-617-1700
sam.christensen@crcnationwide.com
While we strive to provide the most accurate information, all listing information, and demographic data, is provided by third-parties. As such, MyEListing will not be responsible for the accuracy of the information. It is strongly recommended that you verify all information with the listing agent, and any relevant agencies, prior to making any decisions.


