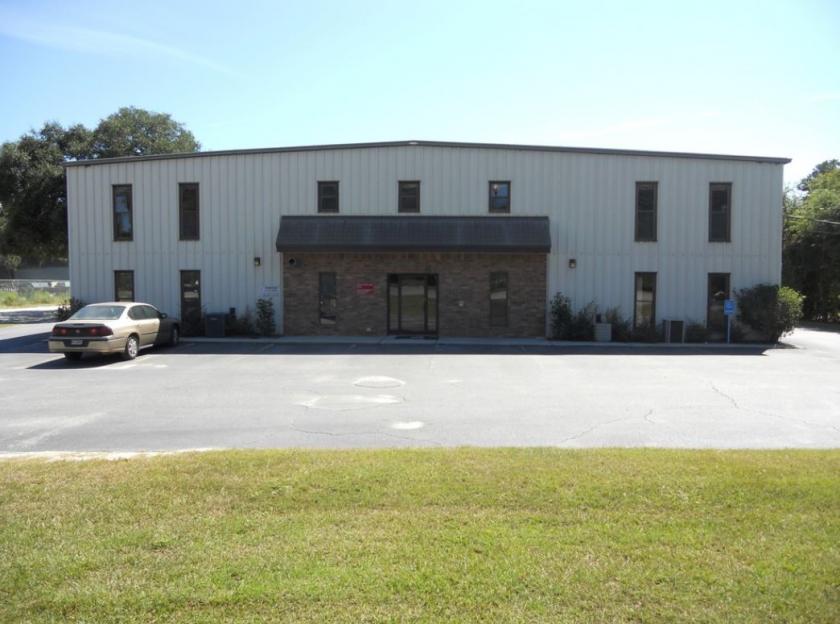
Flex-Office-Warehouse
1620 Dean Forest Road Savannah, GA 31408
1620 Dean Forest Road Savannah, GA 31408
Details & Description
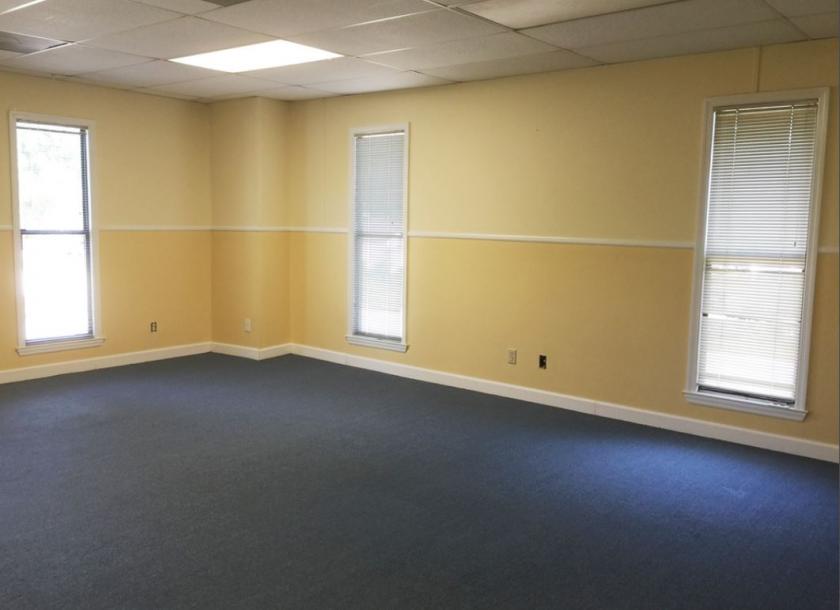
Additional Photos


Listing Agents

Adam Bryant
O: 912-667-2740
adam.bryant@svn.com
O: 912-667-2740
adam.bryant@svn.com
While we strive to provide the most accurate information, all listing information, and demographic data, is provided by third-parties. As such, MyEListing will not be responsible for the accuracy of the information. It is strongly recommended that you verify all information with the listing agent, and any relevant agencies, prior to making any decisions.


