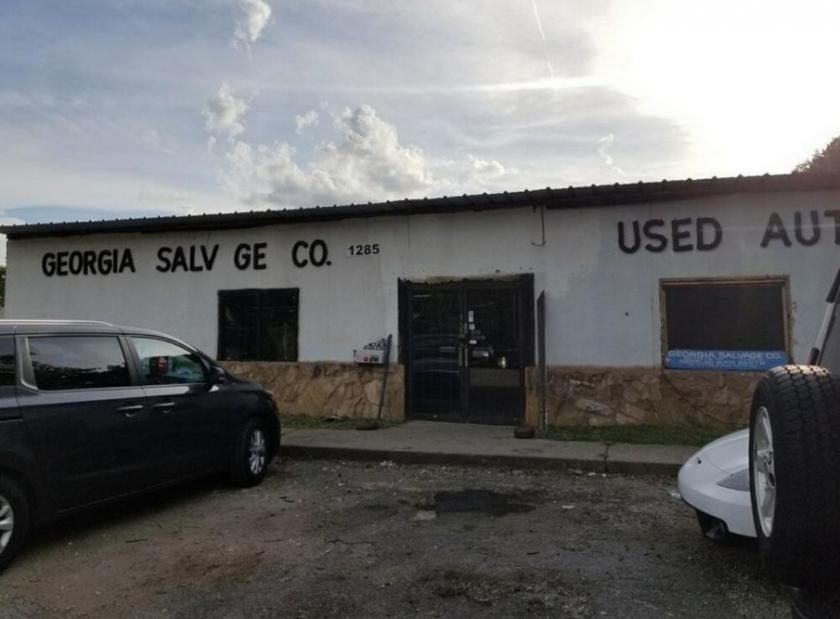
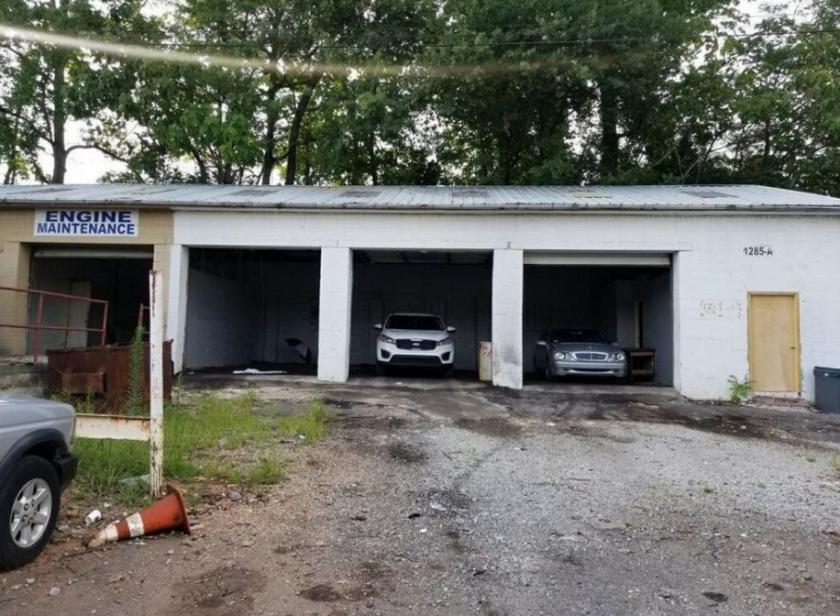
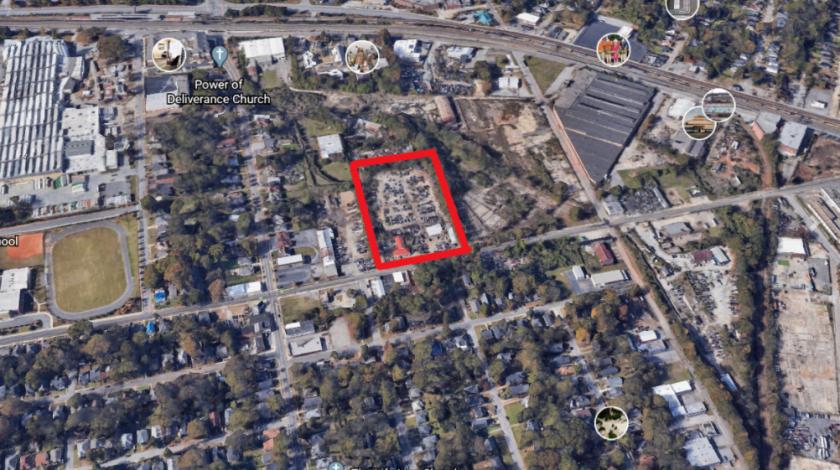
1-Mile | 3-Miles | 5-Miles | ||
---|---|---|---|---|
Total Population | 10,764 | 104,773 | 296,718 | |
Population Median Age | 36 | 36 | 36 | |
Population by Age | 0-9 Yrs | 1543 (14%) | 13620 (12%) | 32424 (10%) |
10-19 Yrs | 1338 (12%) | 14437 (13%) | 36500 (12%) | |
20-29 Yrs | 1639 (15%) | 19013 (18%) | 65143 (21%) | |
30-39 Yrs | 1975 (18%) | 16735 (15%) | 50489 (17%) | |
40-49 Yrs | 1219 (11%) | 11299 (10%) | 33415 (11%) | |
50-59 Yrs | 1208 (11%) | 11622 (11%) | 32333 (10%) | |
60-69 Yrs | 1049 (9%) | 10257 (9%) | 25583 (8%) | |
70+ Yrs | 792 (7%) | 7791 (7%) | 20830 (7%) | |
Median HH Income | $34,715 | $31,936 | $45,191 | |
Total Household Income | < 24K | 1496 (37%) | 16625 (41%) | 37500 (31%) |
25-49K | 1038 (26%) | 10228 (25%) | 26170 (22%) | |
50-74K | 594 (14%) | 5169 (12%) | 17513 (14%) | |
75-99K | 360 (9%) | 3338 (8%) | 11539 (9%) | |
100-199K | 445 (11%) | 3698 (9%) | 19037 (16%) | |
200K+ | 50 (1%) | 998 (2%) | 7019 (5%) | |
Highest Education Level | No Diploma | 1340 | 10591 | 24311 |
Diploma or GED | 2143 | 20539 | 48805 | |
Some College | 1661 | 14030 | 35106 | |
Assoc. Degree | 550 | 4855 | 11256 | |
Bachelors Degree | 956 | 10917 | 42943 | |
Higher Degree | 520 | 6378 | 32921 | |
Total Housing Units | 5,391 | 50,848 | 147,285 | |
--Owner-Occupied | 1,789 | 13,931 | 45,099 | |
--Renter-Occupied | 2,193 | 26,124 | 73,679 | |
Owner-Occupied Values | < 100K | 676 | 4739 | 10729 |
100-199K | 555 | 4381 | 12498 | |
200-299K | 382 | 2373 | 8439 | |
300-399K | 134 | 1224 | 5892 | |
400-499K | 12 | 547 | 2832 | |
500K+ | 30 | 668 | 4709 | |
Total Working Age Population | 8,368 | 83,840 | 248,302 | |
In Work Force | 5,540 | 49,963 | 156,131 | |
Not In Work Force | 2,828 | 33,877 | 92,171 | |
Workforce Employed | 4,953 | 44,592 | 143,461 | |
Workforce Unemployed | 581 | 5,298 | 12,417 | |
Civlian Workforce | 5,534 | 49,890 | 155,879 | |
Military Workforce | 6 | 73 | 253 | |
Total Households | 3,982 | 40,055 | 118,778 | |
Family Households | 1,946 | 17,361 | 48,206 | |
Non-Family Households | 2,036 | 22,694 | 70,572 | |
Married Couple | 635 | 6,025 | 21,932 | |
Other Family | 1,311 | 11,336 | 26,274 | |
Married w/Child | 185 | 1,889 | 6,462 | |
Single Male w/Child | 137 | 736 | 1,686 | |
Single Female w/Child | 456 | 4,817 | 10,917 |
Population Change Last Two Decades - Plus Projection
2000 | % | 2010 | % | 2020 | % | 2030 | |
---|---|---|---|---|---|---|---|
Georgia | 8,186,453 | +18 | 9,687,653 | +12 | 10,833,472 | +13 | 12,292,423 |
Clayton County | 236,517 | +10 | 259,424 | +18 | 304,838 | +22 | 373,234 |
Cobb County | 607,751 | +13 | 688,078 | +15 | 790,588 | +19 | 938,747 |
DeKalb County | 665,865 | +4 | 691,893 | +15 | 793,154 | +19 | 944,045 |
Fulton County | 816,006 | +13 | 920,581 | +19 | 1,099,181 | +18 | 1,300,861 |
Total Working Age Population:
Total Households:
Total Working Age Population:
Total Households:
Total Working Age Population:
Total Households: