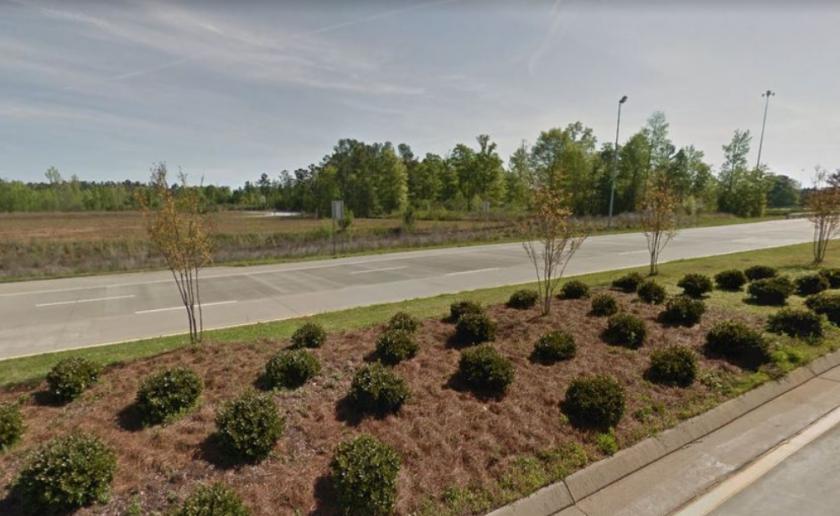
1-Mile | 3-Miles | 5-Miles | ||
---|---|---|---|---|
Total Population | 154 | 2,635 | 9,031 | |
Population Median Age | 36 | 38 | 38 | |
Population by Age | 0-9 Yrs | 23 (14%) | 339 (12%) | 1062 (11%) |
10-19 Yrs | 11 (7%) | 334 (12%) | 1408 (15%) | |
20-29 Yrs | 33 (21%) | 436 (16%) | 1188 (13%) | |
30-39 Yrs | 19 (12%) | 328 (12%) | 1192 (13%) | |
40-49 Yrs | 17 (11%) | 278 (10%) | 904 (10%) | |
50-59 Yrs | 18 (11%) | 353 (13%) | 1325 (14%) | |
60-69 Yrs | 28 (18%) | 306 (11%) | 986 (10%) | |
70+ Yrs | 4 (2%) | 261 (9%) | 967 (10%) | |
Median HH Income | $51,585 | $51,718 | $53,739 | |
Total Household Income | < 24K | 10 (18%) | 285 (30%) | 908 (27%) |
25-49K | 15 (27%) | 171 (18%) | 608 (18%) | |
50-74K | 16 (29%) | 233 (24%) | 774 (23%) | |
75-99K | 5 (9%) | 102 (10%) | 374 (11%) | |
100-199K | 7 (12%) | 127 (13%) | 551 (16%) | |
200K+ | 1 (1%) | 30 (3%) | 89 (2%) | |
Highest Education Level | No Diploma | 20 | 228 | 697 |
Diploma or GED | 55 | 778 | 2472 | |
Some College | 24 | 454 | 1427 | |
Assoc. Degree | 4 | 115 | 431 | |
Bachelors Degree | 5 | 140 | 603 | |
Higher Degree | 3 | 90 | 450 | |
Total Housing Units | 63 | 1,119 | 3,789 | |
--Owner-Occupied | 44 | 744 | 2,543 | |
--Renter-Occupied | 10 | 205 | 761 | |
Owner-Occupied Values | < 100K | 12 | 274 | 862 |
100-199K | 14 | 290 | 1040 | |
200-299K | 14 | 138 | 466 | |
300-399K | 1 | 21 | 85 | |
400-499K | 0 | 0 | 1 | |
500K+ | 2 | 22 | 89 | |
Total Working Age Population | 123 | 2,038 | 6,964 | |
In Work Force | 65 | 1,181 | 4,022 | |
Not In Work Force | 58 | 857 | 2,942 | |
Workforce Employed | 59 | 1,058 | 3,626 | |
Workforce Unemployed | 6 | 103 | 311 | |
Civlian Workforce | 65 | 1,162 | 3,937 | |
Military Workforce | 0 | 19 | 85 | |
Total Households | 54 | 950 | 3,304 | |
Family Households | 39 | 677 | 2,341 | |
Non-Family Households | 15 | 273 | 963 | |
Married Couple | 30 | 490 | 1,683 | |
Other Family | 9 | 187 | 658 | |
Married w/Child | 14 | 201 | 677 | |
Single Male w/Child | 0 | 4 | 52 | |
Single Female w/Child | 2 | 67 | 232 |
Population Change Last Two Decades - Plus Projection
2000 | % | 2010 | % | 2020 | % | 2030 | |
---|---|---|---|---|---|---|---|
Alabama | 4,447,100 | +7 | 4,779,736 | +3 | 4,940,253 | +4 | 5,124,380 |
Chambers County | 36,583 | -6 | 34,215 | -1 | 33,918 | -1 | 33,485 |
Georgia | 8,186,453 | +18 | 9,687,653 | +12 | 10,833,472 | +13 | 12,292,423 |
Harris County | 23,695 | +35 | 32,024 | +8 | 34,712 | +8 | 37,327 |
Troup County | 58,779 | +14 | 67,044 | +5 | 70,414 | +3 | 72,836 |
Total Working Age Population:
Total Households:
Total Working Age Population:
Total Households:
Total Working Age Population:
Total Households: