The 16,508 square foot freestanding building at the corner of Spring and 18th Streets is built out as a conference center and event space. The space can easily function for training, education, meetings, worship or special events. There are 12 parking spaces on site with additional parking available in nearby parking lots and decks.
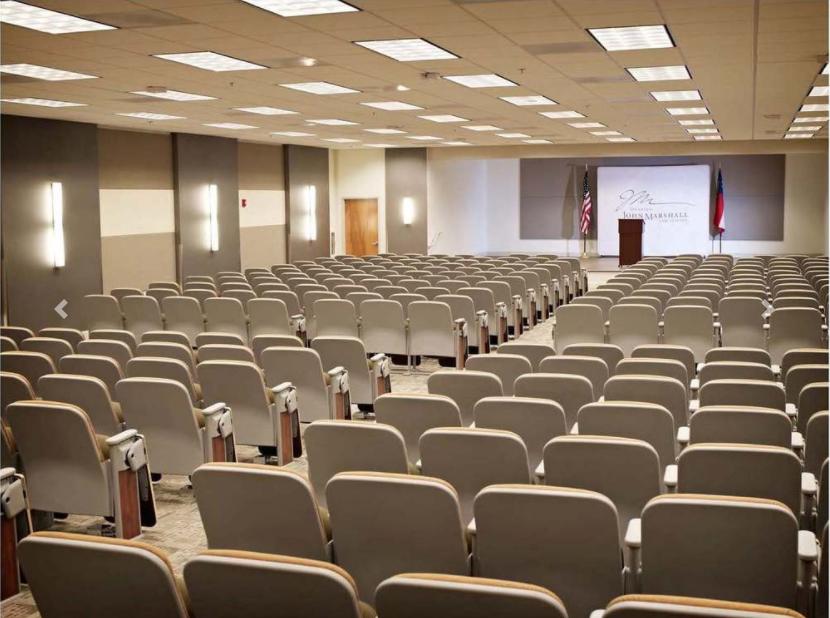
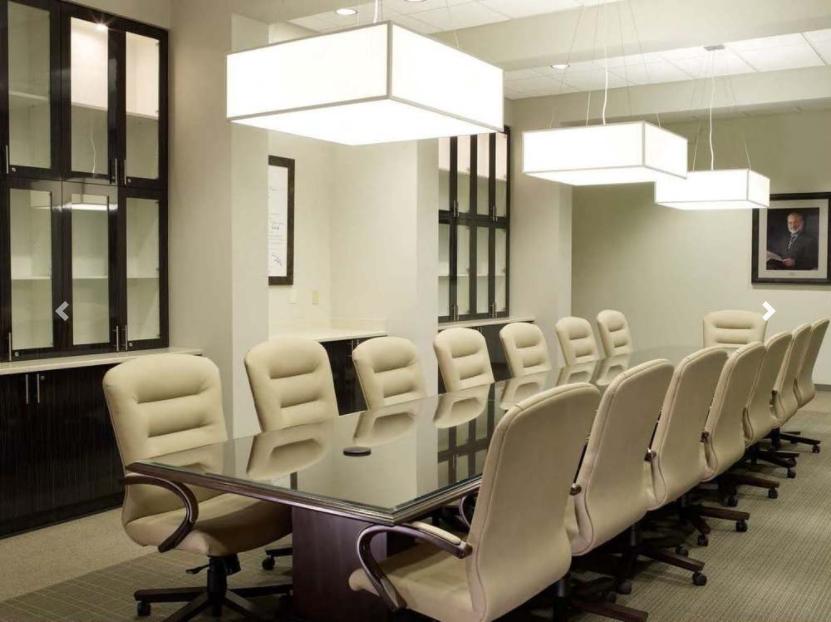
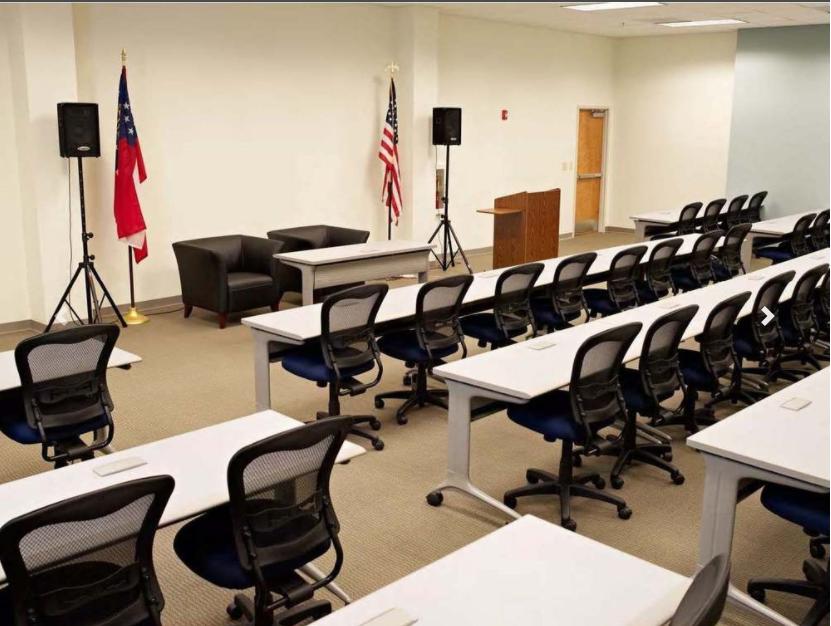
A 350 seat auditorium with stage is served by a reception hall that can support 100 seated guests and 225 standing guests. A more intimate seminar room seats 65, and three conference rooms seat from 8 to 12. Support areas include restrooms, warming kitchen, laundry room, administrative office and storage.
Highlights
16,508 SF Conference Center
350 seat auditorium - full AV, stage, electric outlet in each seat, lighting control
Reception hall- 100 seated, 225 standing reception
Seminar room with flexible classroom seating for up to 65 - full AV
One over-sized conference room- seating for 8-12 with credenza
Two traditional conference rooms- seating for 6
Open lobby and wide corridors- ideal for various functions and registration
Catering warming kitchen and laundry room
Administrative offices, restrorms and storage
12 on site parking spaces & off site parking available
No part of this information may be copied, reproduced, repurposed, or screen-captured for any commercial purpose without prior written authorization from MyEListing.
While we strive to provide the most accurate information, all listing information, and demographic data, is provided by third-parties. As such, MyEListing will not be responsible for the accuracy of the information. It is strongly recommended that you verify all information with the listing agent, and any relevant agencies, prior to making any decisions.
What is the asking price for 1405 Spring Street Northwest in Atlanta?
The asking price for 1405 Spring Street Northwest is $17.50 a SF per Year
What is the building size of this commercial Retail property?
The size of this lease property at '.1405 Spring Street Northwest.' is 16508 square feet
What kind of Retail is the propery at 1405 Spring Street Northwest?
The property at 1405 Spring Street Northwest Atlanta, GA 30309 is listed as a Free Standing Building Retail property
What is the population within 1 mile of 1405 Spring Street Northwest in Atlanta?
The population within 1 mile of 1405 Spring Street Northwest Atlanta, GA 30309 is 24,221 people.
Who do I contact for questions about 1405 Spring Street Northwest?
You should contact the listing agent,
Matthew Levin, for any details regarding this commercial listing.