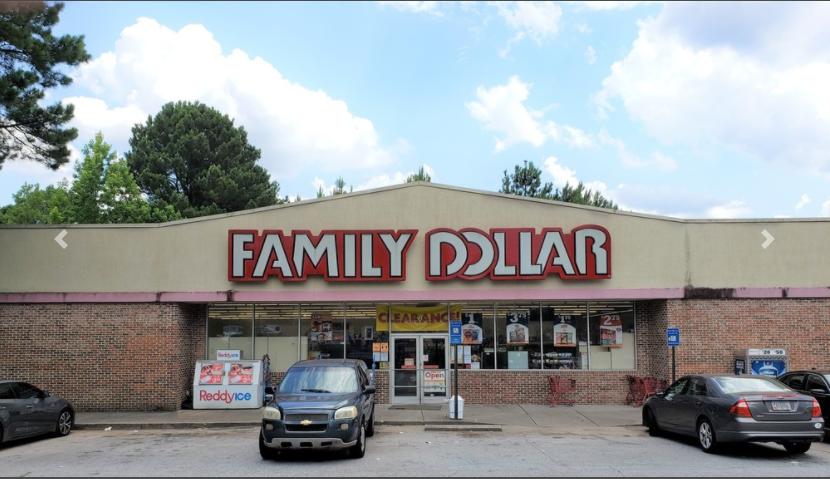
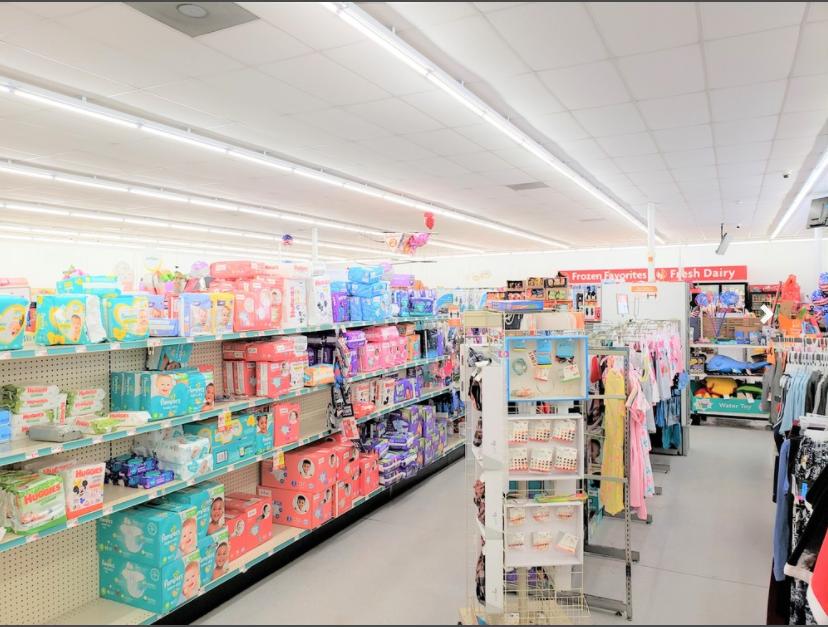
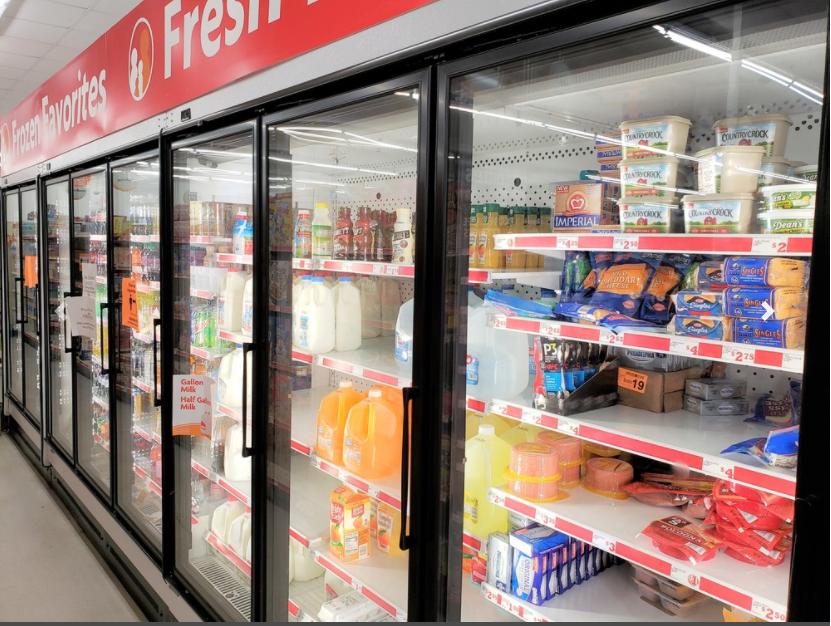
Family Dollar Stores, Inc. with over 8,000 stores in 44 states is a leading discount retail chain in the United States. In 2015, Dollar Tree bought Family Dollar and the combined company has over 15,000 stores in 48 states. Dollar Tree gross sales in 2019 were $23.6 billion an increase from $22.8 billion the prior year. 2019 net income was $827 million. Family Dollar sells merchandise in core categories: health and beauty aids, packaged food and refrigerated products, home cleaning supplies and seasonal goods.The Family Dollar of Hampton, Georgia offers an investor a credit tenant leased property with little management responsibility. The 0.77 acre parcel is improved with an 8,000 square foot retail store of steel and brick construction completed in 2004. The initial ten year NN lease is in the second of four 5-year renewal periods with a current term through June 30, 2024. In addition to rent, the tenant pays a monthly estimate for taxes and insurance with a once per year settle up. The tenant maintains the grounds and parking lot in lieu of paying a CAM charge. The landlord is responsible for repairs to the roof, structure, parking lot and HVAC repairs in excess of $1,000 per lease year.Hampton is located 25 miles south of Atlanta in Henry County and is best known for the Atlanta Motor Speedway (AMS), located 3 minutes from the Property. AMS is a world class NASCAR race track and year-round multipurpose event facility on more than 840 acres. The 3 mile population is 9,500+ with an average household income of $65,000+.HighlightsFamily Dollar NN lease8,000 SF on 0.77 acres zoned C-1 commercial.Built 2004 lease renewed through June 30, 20246,500+ population $65,000 avg HH income 3 milesLocated in Hampton, GA 25 miles south of Atlanta