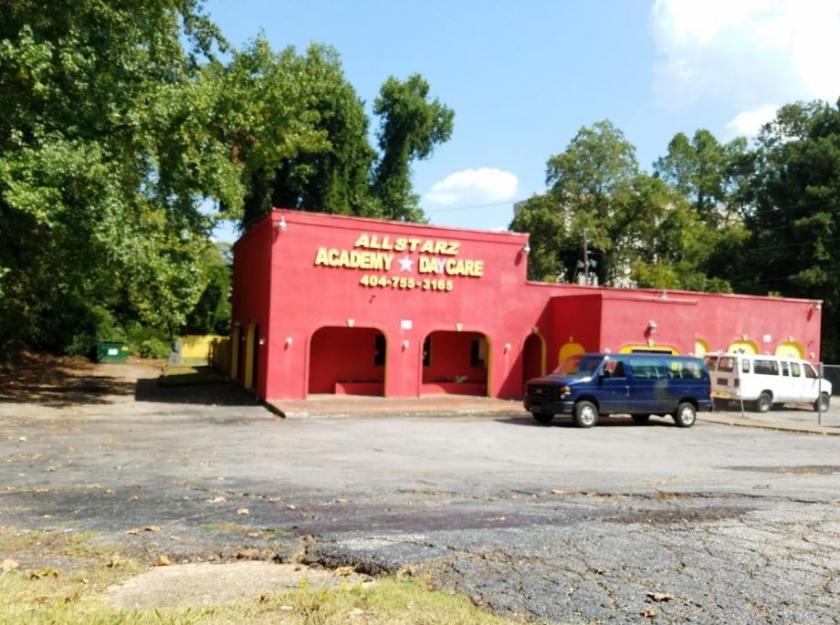
1-Mile | 3-Miles | 5-Miles | ||
---|---|---|---|---|
Total Population | 11,334 | 80,344 | 223,516 | |
Population Median Age | 37 | 38 | 37 | |
Population by Age | 0-9 Yrs | 1584 (13%) | 10726 (13%) | 30855 (13%) |
10-19 Yrs | 1299 (11%) | 9277 (11%) | 29723 (13%) | |
20-29 Yrs | 1919 (16%) | 12184 (15%) | 35475 (15%) | |
30-39 Yrs | 1451 (12%) | 11153 (13%) | 32015 (14%) | |
40-49 Yrs | 1305 (11%) | 9285 (11%) | 25806 (11%) | |
50-59 Yrs | 1497 (13%) | 10357 (12%) | 26838 (12%) | |
60-69 Yrs | 1409 (12%) | 9195 (11%) | 23041 (10%) | |
70+ Yrs | 870 (7%) | 8166 (10%) | 19763 (8%) | |
Median HH Income | $22,036 | $36,796 | $35,133 | |
Total Household Income | < 24K | 2629 (54%) | 11408 (36%) | 32110 (37%) |
25-49K | 1102 (22%) | 8091 (25%) | 23583 (27%) | |
50-74K | 432 (8%) | 5370 (17%) | 13402 (15%) | |
75-99K | 296 (6%) | 2682 (8%) | 7295 (8%) | |
100-199K | 310 (6%) | 3349 (10%) | 8032 (9%) | |
200K+ | 55 (1%) | 639 (2%) | 1618 (1%) | |
Highest Education Level | No Diploma | 1075 | 7473 | 21563 |
Diploma or GED | 2902 | 17692 | 46244 | |
Some College | 1447 | 11511 | 30437 | |
Assoc. Degree | 721 | 4179 | 10767 | |
Bachelors Degree | 1032 | 8960 | 23265 | |
Higher Degree | 578 | 5525 | 13965 | |
Total Housing Units | 6,192 | 39,636 | 107,936 | |
--Owner-Occupied | 1,215 | 13,699 | 31,385 | |
--Renter-Occupied | 3,608 | 17,839 | 54,653 | |
Owner-Occupied Values | < 100K | 703 | 5098 | 11705 |
100-199K | 404 | 5092 | 11297 | |
200-299K | 49 | 1947 | 4865 | |
300-399K | 50 | 1045 | 2066 | |
400-499K | 0 | 183 | 544 | |
500K+ | 10 | 334 | 909 | |
Total Working Age Population | 8,766 | 63,747 | 175,410 | |
In Work Force | 5,109 | 39,223 | 105,708 | |
Not In Work Force | 3,657 | 24,523 | 69,702 | |
Workforce Employed | 4,635 | 35,525 | 95,113 | |
Workforce Unemployed | 461 | 3,638 | 10,504 | |
Civlian Workforce | 5,096 | 39,163 | 105,617 | |
Military Workforce | 12 | 60 | 91 | |
Total Households | 4,824 | 31,538 | 86,038 | |
Family Households | 2,124 | 15,970 | 41,029 | |
Non-Family Households | 2,700 | 15,568 | 45,009 | |
Married Couple | 718 | 6,310 | 14,334 | |
Other Family | 1,405 | 9,660 | 26,695 | |
Married w/Child | 203 | 1,757 | 4,163 | |
Single Male w/Child | 89 | 670 | 1,597 | |
Single Female w/Child | 481 | 3,276 | 11,107 |
Population Change Last Two Decades - Plus Projection
2000 | % | 2010 | % | 2020 | % | 2030 | |
---|---|---|---|---|---|---|---|
Georgia | 8,186,453 | +18 | 9,687,653 | +12 | 10,833,472 | +13 | 12,292,423 |
Clayton County | 236,517 | +10 | 259,424 | +18 | 304,838 | +22 | 373,234 |
Cobb County | 607,751 | +13 | 688,078 | +15 | 790,588 | +19 | 938,747 |
Fulton County | 816,006 | +13 | 920,581 | +19 | 1,099,181 | +18 | 1,300,861 |
Total Working Age Population:
Total Households:
Total Working Age Population:
Total Households:
Total Working Age Population:
Total Households: