Multifamily Housing
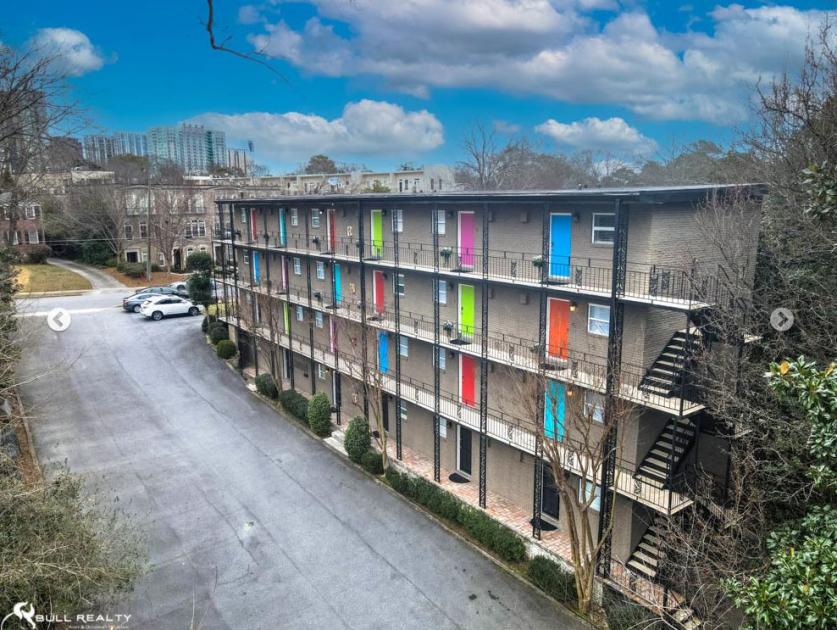
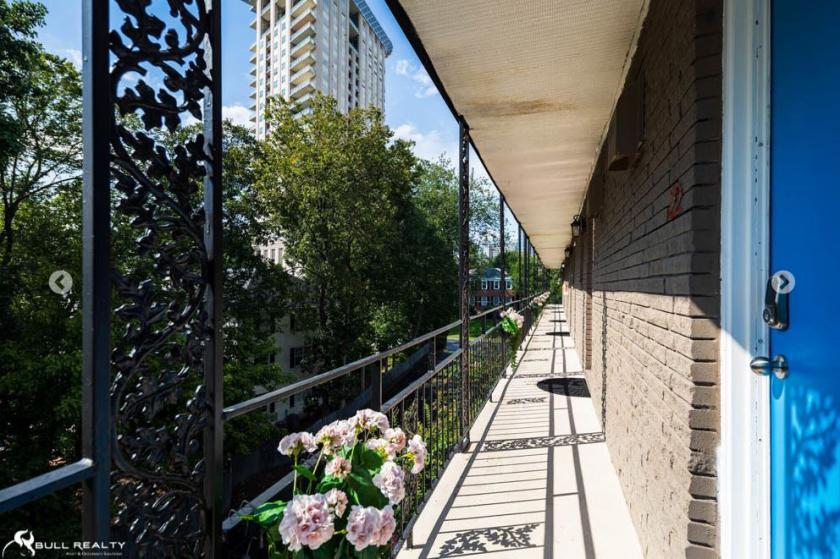
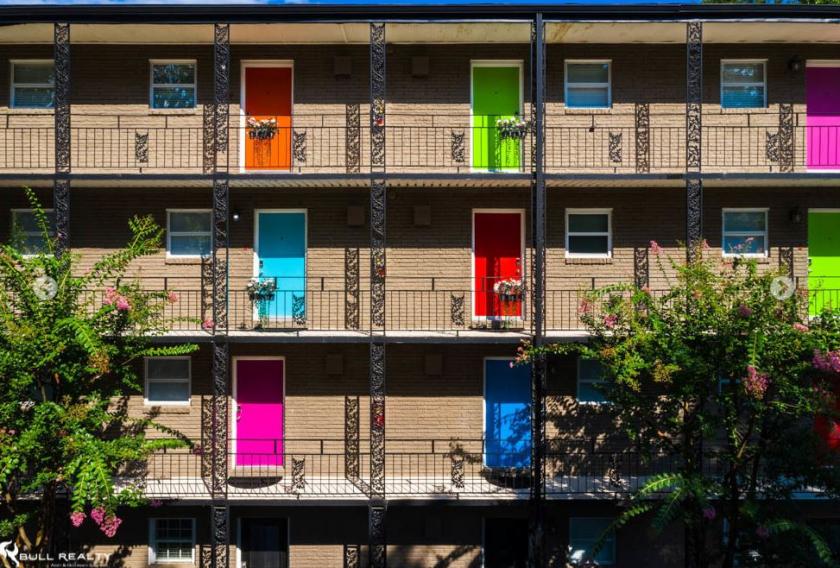
45 Sheridan Drive Northeast Atlanta, GA 30305
45 Sheridan Drive Northeast Atlanta, GA 30305
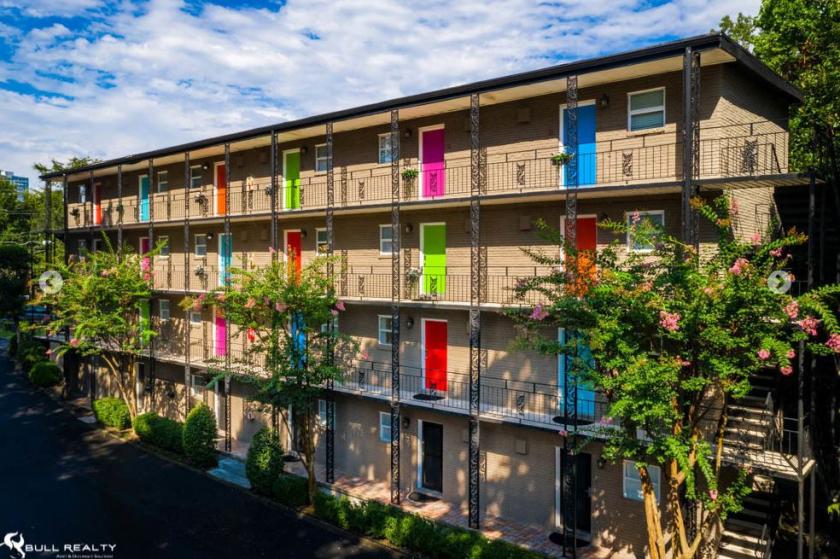
Details & Description
Additional Photos
Listing Agents

Marco Welch
O: 404876164013
marco@bullrealty.com
O: 404876164013
marco@bullrealty.com
While we strive to provide the most accurate information, all listing information, and demographic data, is provided by third-parties. As such, MyEListing will not be responsible for the accuracy of the information. It is strongly recommended that you verify all information with the listing agent, and any relevant agencies, prior to making any decisions.


