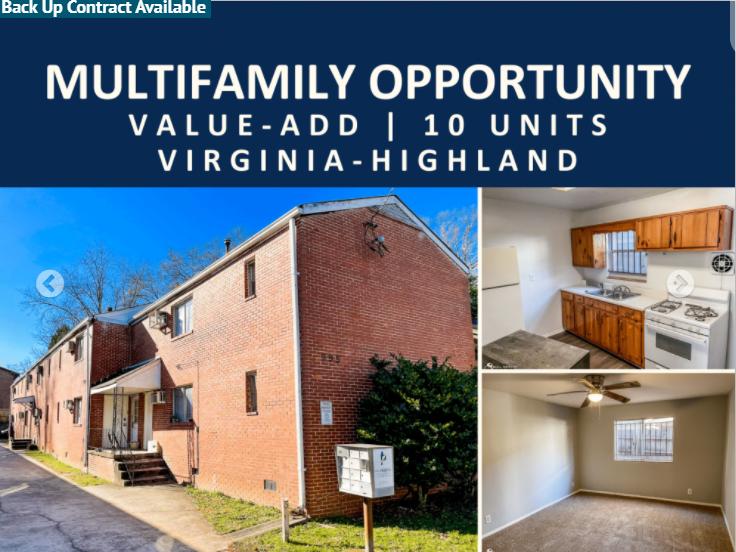
• 10-unit apartment building in the heart of the popular Virginia-Highland neighborhood
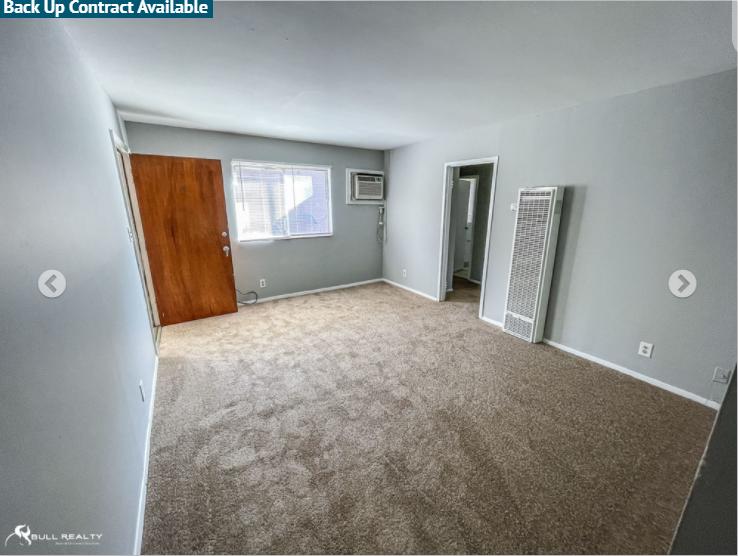
• All spacious 1 bedroom/ 1 bathroom units
• 90% occupancy
• Interior stairwells with key access
• Off-street parking on side and rear of building
• All units have wall heat and window AC
• Excellent location in highly sought-after Virginia-Highland neighborhood
• Walking distance to popular bars and restaurants, Ponce City Market and the Atlanta BeltLine
• High barriers to entry, low vacancy and strong area rents
• All units in basic condition with below-market rents
• Value-Add opportunity through cosmetic renovations to increase rents
No part of this information may be copied, reproduced, repurposed, or screen-captured for any commercial purpose without prior written authorization from MyEListing.
While we strive to provide the most accurate information, all listing information, and demographic data, is provided by third-parties. As such, MyEListing will not be responsible for the accuracy of the information. It is strongly recommended that you verify all information with the listing agent, and any relevant agencies, prior to making any decisions.
What is the asking price for 995 Greenwood Avenue Northeast in Atlanta?
The asking price for 995 Greenwood Avenue Northeast is $1,350,000
What is the building size of this Multifamily property in Atlanta, GA?
The size of the building/unit at 995 Greenwood Avenue Northeast in Atlanta is 7,184 square feet
How much land does the Atlanta, GA property at 995 Greenwood Avenue Northeast include?
995 Greenwood Avenue Northeast in Atlanta includes 0.230 acres of land
What is the population within 1 mile of 995 Greenwood Avenue Northeast in Atlanta?
The population within 1 mile of 995 Greenwood Avenue Northeast Atlanta, GA 30306 is 21,747 people.
Who do I contact for questions about 995 Greenwood Avenue Northeast?
You should contact the listing agent,
Andy Lundsberg, for any details regarding this commercial listing.