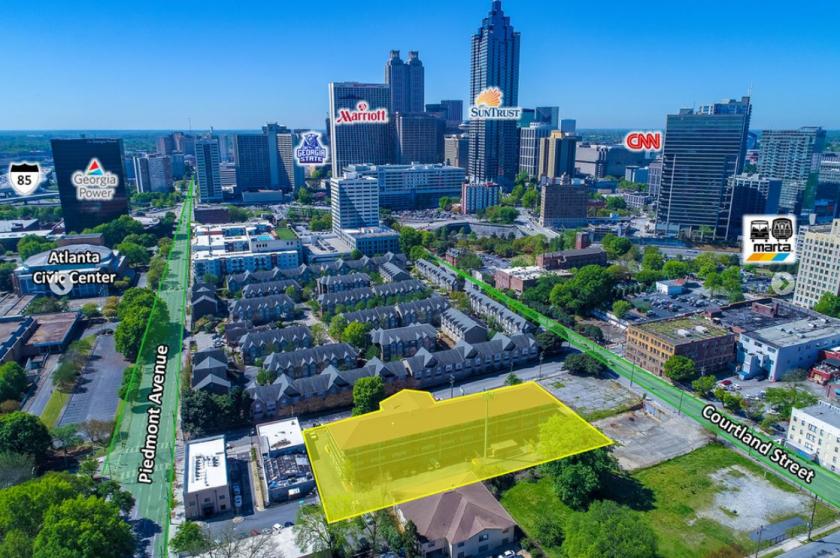
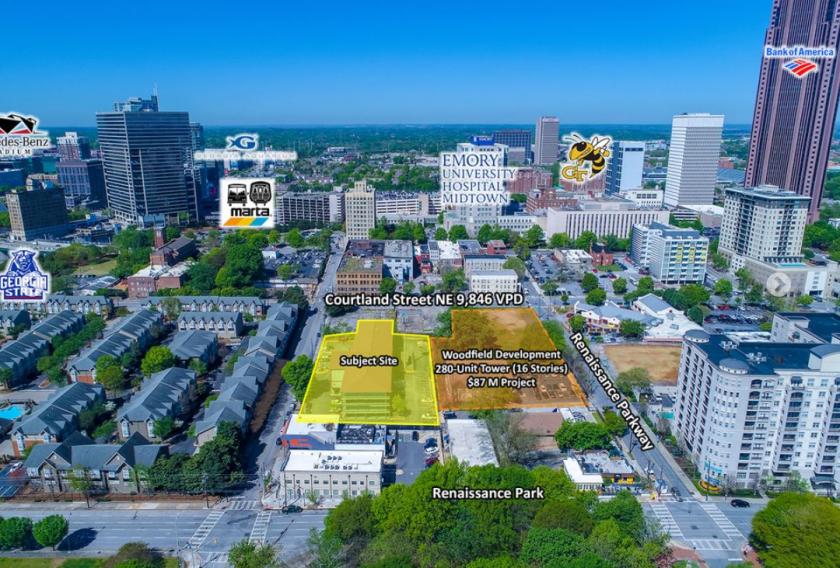
Bull Realty is pleased to exclusively present the opportunity to acquire this 1.22-acre infill redevelopment site. Located in the SoNo district in Midtown Atlanta, this area is emerging as one of the fastest growing areas in Atlanta. This property is walking distance to Marta and two blocks east of Emory Medical. This area has seen unprecedented growth as the demand (especially for multifamily) development continues to rise in SoNo.
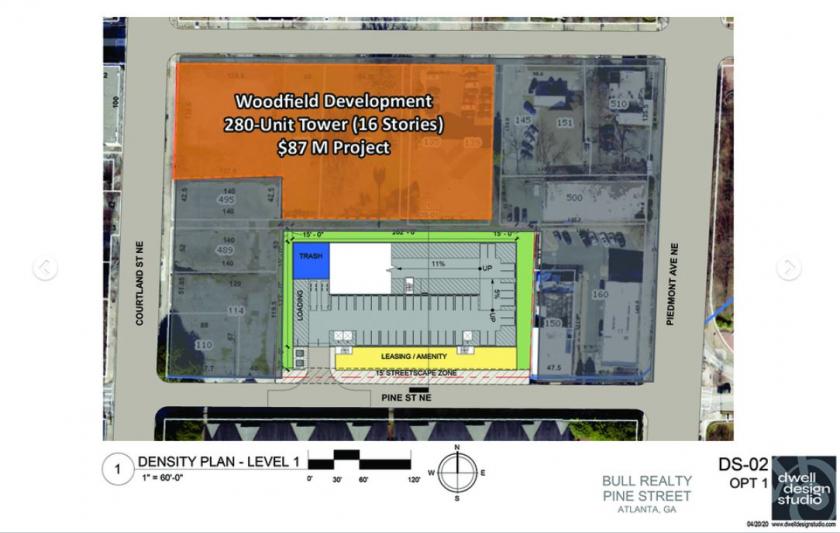
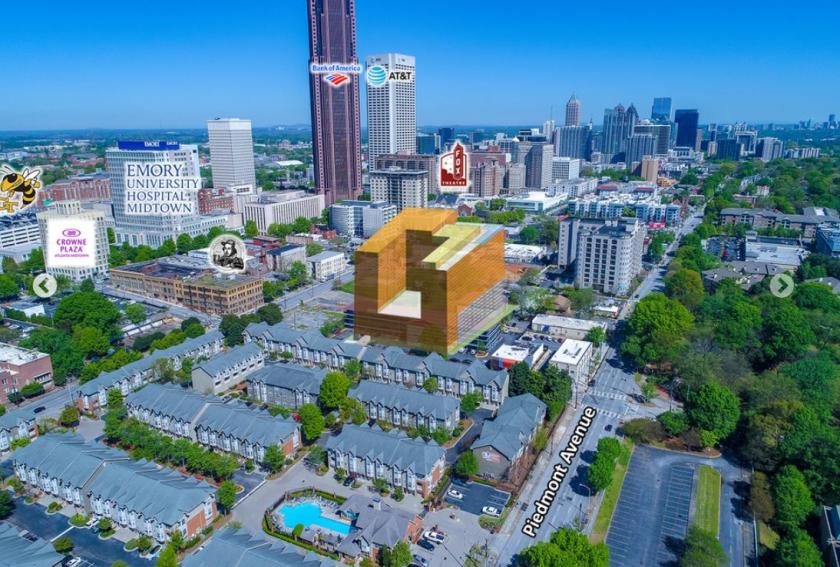
Local zoning code, Special Public Interest (SPA-1; SA-3), allows for this site to be improved with a 25-level building which includes 8 levels of parking. A density study shows if the site is assembled, a mixed-use development containing 465 multifamily units should be permitted. The permitted uses include multifamily, hotel, student housing, office and retail. Developers are further attracted to this district because of the property tax breaks which have been granted by the City to off-set record high land prices. Development profits are also enhanced by the property being located within Atlanta’s Community Improvement District (CID) and the Downtown Tax Allocation District (TAD) which provide additional financial incentives.
This property has an income component providing contributory value while developers work through the design and permitting process. The existing improvement consists of a 169-room (plus 1 manager's room apartment) Budgetel Inn & Suites. During the renovation process, this extended stay hotel grossed over $2 million dollars in 2019. If sold to a developer, the Seller is willing to leaseback the Property and will pay the new owner $480,000 for each of the next three years.
This property is being marketed for sale at an unpriced amount. Seller reserves the right to accept an offer earlier, the top bidders will be invited back to a best and final round in July of 2020.
Please reach out to Will Young or Perry Hayes at Bull Realty, Inc. if you would like to submit an offer or discuss this opportunity.
No part of this information may be copied, reproduced, repurposed, or screen-captured for any commercial purpose without prior written authorization from MyEListing.
While we strive to provide the most accurate information, all listing information, and demographic data, is provided by third-parties. As such, MyEListing will not be responsible for the accuracy of the information. It is strongly recommended that you verify all information with the listing agent, and any relevant agencies, prior to making any decisions.
How much land does the Atlanta, GA property at 140 Pine Street Northeast include?
140 Pine Street Northeast in Atlanta includes 1.220 acres of land
What kind of Land is the propery at 140 Pine Street Northeast?
The property at 140 Pine Street Northeast Atlanta, GA 30308 is listed as a Mixed Use Land Land property
What is the population within 1 mile of 140 Pine Street Northeast in Atlanta?
The population within 1 mile of 140 Pine Street Northeast Atlanta, GA 30308 is 38,101 people.
Who do I contact for questions about 140 Pine Street Northeast?
You should contact the listing agent,
Will Young, for any details regarding this commercial listing.