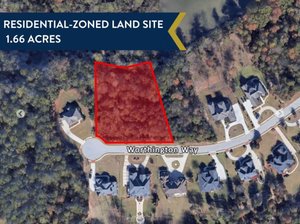
1-Mile | 3-Miles | 5-Miles | ||
---|---|---|---|---|
Total Population | 7,536 | 69,416 | 177,267 | |
Population Median Age | 37 | 39 | 38 | |
Population by Age | 0-9 Yrs | 1230 (16%) | 9167 (13%) | 24620 (13%) |
10-19 Yrs | 927 (12%) | 7869 (11%) | 22608 (12%) | |
20-29 Yrs | 1221 (16%) | 10123 (14%) | 25299 (14%) | |
30-39 Yrs | 744 (9%) | 8989 (12%) | 24303 (13%) | |
40-49 Yrs | 966 (12%) | 9028 (13%) | 22172 (12%) | |
50-59 Yrs | 1026 (13%) | 8878 (12%) | 22399 (12%) | |
60-69 Yrs | 666 (8%) | 7799 (11%) | 18487 (10%) | |
70+ Yrs | 755 (10%) | 7564 (10%) | 17379 (9%) | |
Median HH Income | $37,604 | $40,320 | $38,734 | |
Total Household Income | < 24K | 904 (33%) | 8933 (32%) | 23188 (33%) |
25-49K | 759 (28%) | 7318 (26%) | 18363 (26%) | |
50-74K | 508 (19%) | 5043 (18%) | 11573 (16%) | |
75-99K | 176 (6%) | 2493 (9%) | 6155 (8%) | |
100-199K | 276 (10%) | 3078 (11%) | 7634 (11%) | |
200K+ | 47 (1%) | 673 (2%) | 1551 (2%) | |
Highest Education Level | No Diploma | 618 | 5499 | 15342 |
Diploma or GED | 1771 | 14486 | 36817 | |
Some College | 1019 | 10131 | 24802 | |
Assoc. Degree | 331 | 3716 | 9451 | |
Bachelors Degree | 669 | 8273 | 19696 | |
Higher Degree | 529 | 6176 | 13110 | |
Total Housing Units | 3,277 | 32,483 | 83,725 | |
--Owner-Occupied | 1,258 | 11,799 | 28,525 | |
--Renter-Occupied | 1,411 | 15,740 | 39,940 | |
Owner-Occupied Values | < 100K | 443 | 3899 | 9726 |
100-199K | 550 | 4802 | 10438 | |
200-299K | 161 | 1821 | 5077 | |
300-399K | 72 | 838 | 2070 | |
400-499K | 9 | 120 | 489 | |
500K+ | 22 | 320 | 725 | |
Total Working Age Population | 5,686 | 55,360 | 138,156 | |
In Work Force | 3,544 | 33,122 | 85,034 | |
Not In Work Force | 2,142 | 22,237 | 53,121 | |
Workforce Employed | 3,129 | 30,331 | 76,757 | |
Workforce Unemployed | 399 | 2,754 | 8,199 | |
Civlian Workforce | 3,528 | 33,085 | 84,956 | |
Military Workforce | 16 | 37 | 78 | |
Total Households | 2,669 | 27,538 | 68,465 | |
Family Households | 1,703 | 14,101 | 34,947 | |
Non-Family Households | 966 | 13,437 | 33,518 | |
Married Couple | 543 | 5,582 | 13,221 | |
Other Family | 1,160 | 8,519 | 21,725 | |
Married w/Child | 196 | 1,527 | 3,864 | |
Single Male w/Child | 32 | 482 | 1,451 | |
Single Female w/Child | 467 | 3,051 | 8,480 |
Population Change Last Two Decades - Plus Projection
2000 | % | 2010 | % | 2020 | % | 2030 | |
---|---|---|---|---|---|---|---|
Georgia | 8,186,453 | +18 | 9,687,653 | +12 | 10,833,472 | +13 | 12,292,423 |
Clayton County | 236,517 | +10 | 259,424 | +18 | 304,838 | +22 | 373,234 |
Cobb County | 607,751 | +13 | 688,078 | +15 | 790,588 | +19 | 938,747 |
Douglas County | 92,174 | +44 | 132,403 | +15 | 151,906 | +20 | 182,157 |
Fulton County | 816,006 | +13 | 920,581 | +19 | 1,099,181 | +18 | 1,300,861 |
Total Working Age Population:
Total Households:
Total Working Age Population:
Total Households:
Total Working Age Population:
Total Households: