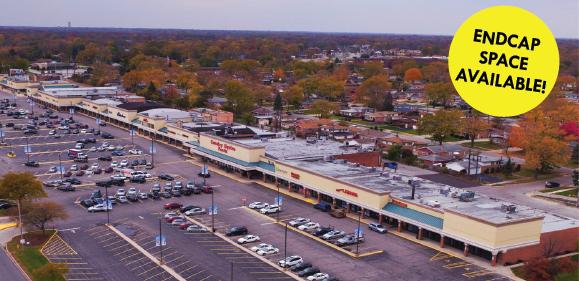
1-Mile | 3-Miles | 5-Miles | ||
---|---|---|---|---|
Total Population | 12,221 | 72,394 | 177,317 | |
Population Median Age | 38 | 39 | 39 | |
Population by Age | 0-9 Yrs | 1573 (12%) | 9534 (13%) | 20815 (11%) |
10-19 Yrs | 1789 (14%) | 10528 (14%) | 25940 (14%) | |
20-29 Yrs | 1617 (13%) | 8643 (11%) | 23059 (13%) | |
30-39 Yrs | 1531 (12%) | 8597 (11%) | 19832 (11%) | |
40-49 Yrs | 1644 (13%) | 9182 (12%) | 22774 (12%) | |
50-59 Yrs | 1504 (12%) | 9703 (13%) | 24709 (13%) | |
60-69 Yrs | 1249 (10%) | 8358 (11%) | 21664 (12%) | |
70+ Yrs | 1313 (10%) | 7849 (10%) | 18524 (10%) | |
Median HH Income | $62,923 | $62,894 | $58,965 | |
Total Household Income | < 24K | 677 (16%) | 5371 (20%) | 13862 (21%) |
25-49K | 781 (19%) | 5168 (20%) | 14034 (21%) | |
50-74K | 930 (22%) | 4084 (15%) | 10801 (16%) | |
75-99K | 766 (18%) | 3958 (15%) | 9266 (14%) | |
100-199K | 852 (20%) | 5801 (22%) | 14792 (22%) | |
200K+ | 96 (2%) | 1437 (5%) | 2503 (3%) | |
Highest Education Level | No Diploma | 1162 | 5321 | 10247 |
Diploma or GED | 2297 | 11970 | 31361 | |
Some College | 2190 | 12318 | 33262 | |
Assoc. Degree | 552 | 3890 | 10088 | |
Bachelors Degree | 1020 | 7883 | 20192 | |
Higher Degree | 720 | 6496 | 13510 | |
Total Housing Units | 4,498 | 29,113 | 73,212 | |
--Owner-Occupied | 3,212 | 18,429 | 44,755 | |
--Renter-Occupied | 890 | 7,390 | 20,503 | |
Owner-Occupied Values | < 100K | 980 | 5891 | 15564 |
100-199K | 1897 | 8452 | 20633 | |
200-299K | 214 | 2580 | 5690 | |
300-399K | 75 | 797 | 1698 | |
400-499K | 33 | 336 | 544 | |
500K+ | 12 | 373 | 626 | |
Total Working Age Population | 9,602 | 56,252 | 140,773 | |
In Work Force | 6,201 | 35,586 | 89,016 | |
Not In Work Force | 3,402 | 20,666 | 51,757 | |
Workforce Employed | 5,489 | 32,273 | 79,535 | |
Workforce Unemployed | 693 | 3,256 | 9,361 | |
Civlian Workforce | 6,182 | 35,529 | 88,896 | |
Military Workforce | 18 | 58 | 120 | |
Total Households | 4,101 | 25,819 | 65,258 | |
Family Households | 2,764 | 17,330 | 42,363 | |
Non-Family Households | 1,337 | 8,489 | 22,895 | |
Married Couple | 1,826 | 10,526 | 24,798 | |
Other Family | 939 | 6,804 | 17,564 | |
Married w/Child | 799 | 4,018 | 8,538 | |
Single Male w/Child | 113 | 865 | 1,790 | |
Single Female w/Child | 251 | 2,440 | 6,438 |
Population Change Last Two Decades - Plus Projection
2000 | % | 2010 | % | 2020 | % | 2030 | |
---|---|---|---|---|---|---|---|
Illinois | 12,419,293 | +3 | 12,830,632 | +12 | 14,316,487 | +6 | 15,138,849 |
Cook County | 5,376,741 | -3 | 5,194,675 | +10 | 5,707,832 | +5 | 5,990,243 |
Will County | 502,266 | +35 | 677,560 | +34 | 907,625 | +20 | 1,093,207 |
Total Working Age Population:
Total Households:
Total Working Age Population:
Total Households:
Total Working Age Population:
Total Households: