Commercial Spaces For Lease
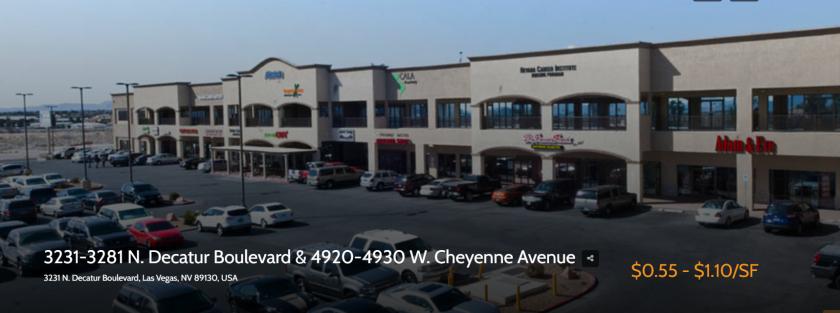
At the intersection of three major traffic routes, Decatur Boulevard, Cheyenne Avenue, and Rancho Drive, the Red Feather Plaza is in an easy to find, easy to access location directly at the northwest corner of the North Las Vegas Airport. The center has undergone extensive renovations which includes an attractive facade, outdoor break areas, an elevator and escalators. It offers multiple eating establishments and is surrounded by retail, industrial and both multi-family and single family residential areas.
Highlights:
Office, retail and warehouse
Located at one of the busiest intersections in North Las Vegas
First and second floor units available
Large warehouse spaces with roll up doors
Cheyenne & Decatur exposure
Digital sign on Cheyenne for tenant exposure
No part of this information may be copied, reproduced, repurposed, or screen-captured for any commercial purpose without prior written authorization from MyEListing.
While we strive to provide the most accurate information, all listing information, and demographic data, is provided by third-parties. As such, MyEListing will not be responsible for the accuracy of the information. It is strongly recommended that you verify all information with the listing agent, and any relevant agencies, prior to making any decisions.
What is the asking price for 3281 North Decatur Boulevard in Las Vegas?
The asking price for 3281 North Decatur Boulevard is $6.60 - $13.20 a SF per Year
What is the building size of this commercial Retail property?
The size of this multi-unit property varies between 1018 - 5065 square feet
What kind of Retail is the propery at 3281 North Decatur Boulevard?
The property at 3281 North Decatur Boulevard Las Vegas, NV 89130 is listed as a Shopping Center Retail property
What is the population within 1 mile of 3281 North Decatur Boulevard in Las Vegas?
The population within 1 mile of 3281 North Decatur Boulevard Las Vegas, NV 89130 is 16,916 people.
Who do I contact for questions about 3281 North Decatur Boulevard?
You should contact the listing agent,
Travis Laub, for any details regarding this commercial listing.