Specialty Real Estate
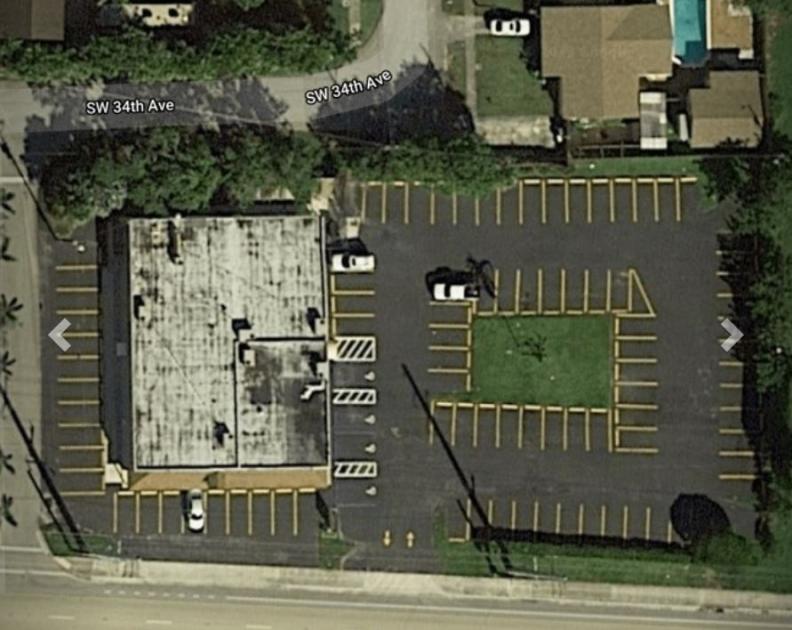
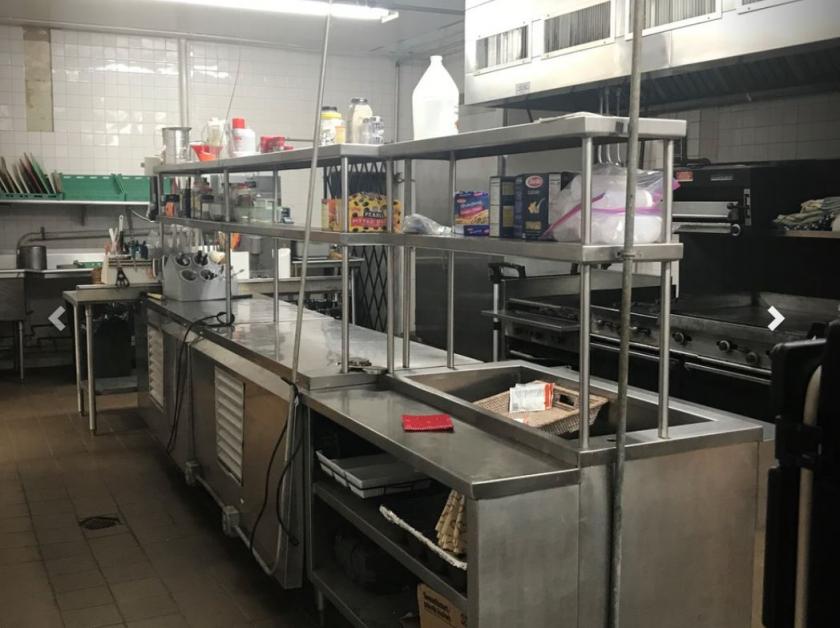
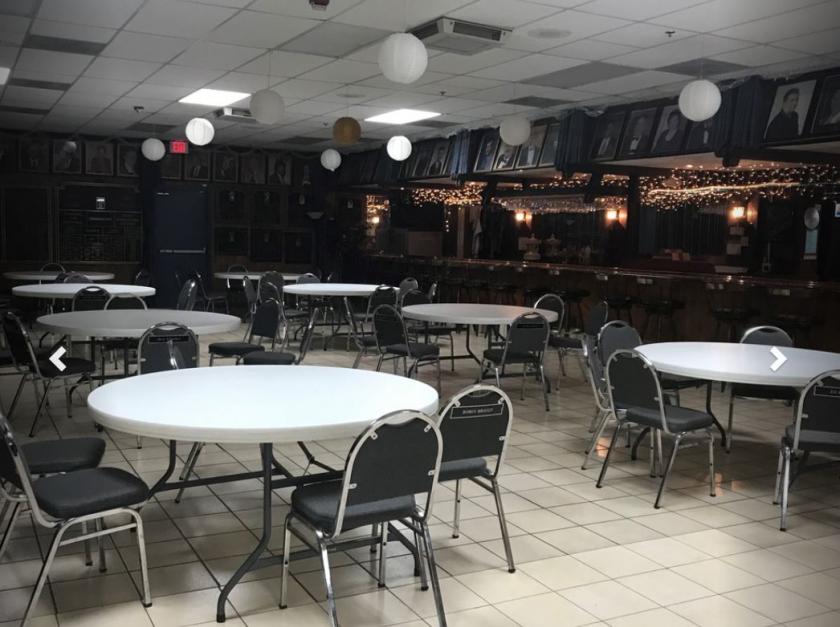
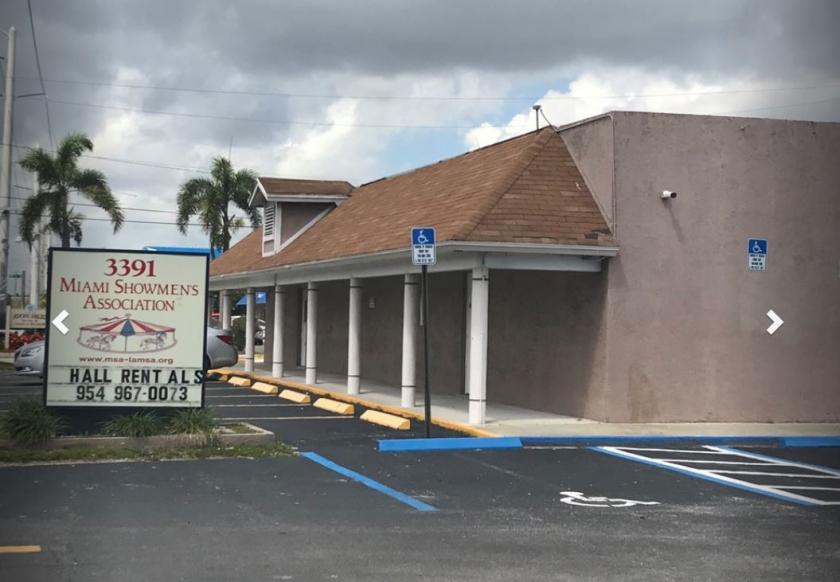
3391 Griffin Road Fort Lauderdale, FL 33312
3391 Griffin Road Fort Lauderdale, FL 33312
Details & Description
Additional Photos
Listing Agents

Joseph Byrnes
O: 954-358-0900
M: 954-652-2048
jbyrnes@bergercommercial.com
O: 954-358-0900
M: 954-652-2048
jbyrnes@bergercommercial.com
While we strive to provide the most accurate information, all listing information, and demographic data, is provided by third-parties. As such, MyEListing will not be responsible for the accuracy of the information. It is strongly recommended that you verify all information with the listing agent, and any relevant agencies, prior to making any decisions.


