Highlights
Excellent Value Add/Redevopment Opportunity in a major Southwest Corridor.
Ability to build outlots by right and/or upgrade property allows for assurance of meeting opportunity zone criteria.
Only $58.86/sf for Building and $14.32/sf for land!
Strong historical occupancy by nationally recognized brands.
Pro Forma NOI of $308,605 CAP rate of 10.3 Cap.
Cross access to new Food4Less development.
Main artery; Sibley Blvd (37,000 VPD), and epicenter of Dolton retail.
Outlots offer potential for additional rent revenues or sale proceeds to recoup down payment.
Description
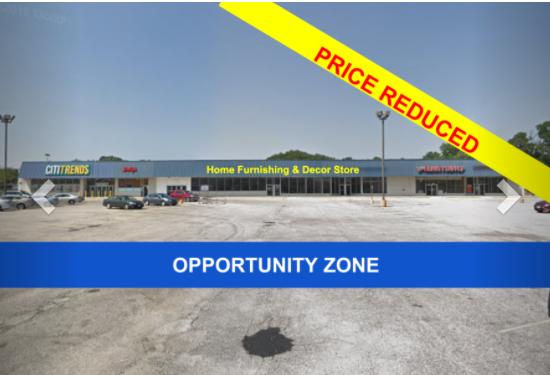
First Western Properties, inc. has been retained as the exclusive listing broker for the sale of Dolton Plaza, located at 1024-1048 E. Sibley Blvd., Dolton, IL 60419. Dolton Plaza is an approximate 50,886 square feet retail shopping center with out-parcels. The property is adjacent to a newly constructed Food4Less with connecting drives that provide a free flow of customer traffic from one retail development to the next. The center attracts credit tenant such as Dollar General, Rent-A-Center, and Burger King. The center has great visibility on heavily trafficked Sibley Blvd. Dolton Plaza is located in the retail hub of Dolton on the major retail artery of Sibley.
NOI and Cap rate are reflective of a stabalized income without inclusion of upside from outlot development or sales.
Location
Located at 1024-48 E Sibley Blvd in Dolton Next to New Food 4 Less Development
No part of this information may be copied, reproduced, repurposed, or screen-captured for any commercial purpose without prior written authorization from MyEListing.
While we strive to provide the most accurate information, all listing information, and demographic data, is provided by third-parties. As such, MyEListing will not be responsible for the accuracy of the information. It is strongly recommended that you verify all information with the listing agent, and any relevant agencies, prior to making any decisions.
What is the asking price for 1024 Sibley Boulevard in Dolton?
The asking price for 1024 Sibley Boulevard is $2,995,000
What is the building size of this Retail property in Dolton, IL?
The size of the building/unit at 1024 Sibley Boulevard in Dolton is 50,886 square feet
How much land does the Dolton, IL property at 1024 Sibley Boulevard include?
1024 Sibley Boulevard in Dolton includes 4.800 acres of land
What kind of Retail is the propery at 1024 Sibley Boulevard?
The property at 1024 Sibley Boulevard Dolton, IL 60419 is listed as a Shopping Center Retail property
What is the population within 1 mile of 1024 Sibley Boulevard in Dolton?
The population within 1 mile of 1024 Sibley Boulevard Dolton, IL 60419 is 19,904 people.
Who do I contact for questions about 1024 Sibley Boulevard?
You should contact the listing agent,
Paul Tsakiris, for any details regarding this commercial listing.