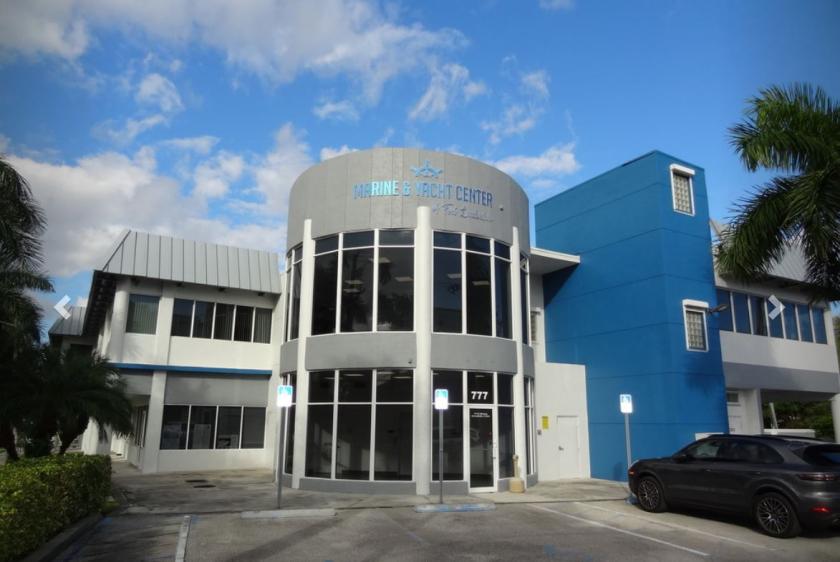
Office Space
777 Southeast 20th Street Fort Lauderdale, FL 33316
777 Southeast 20th Street Fort Lauderdale, FL 33316
Details & Description
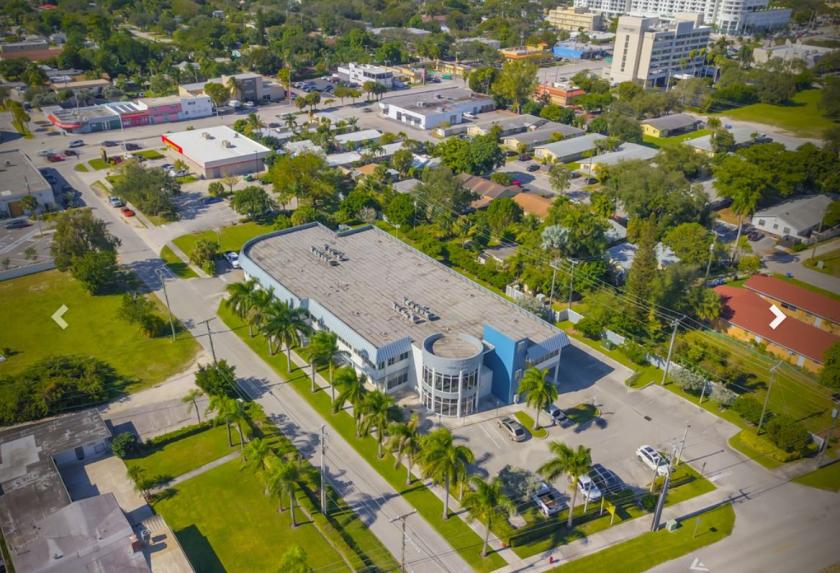
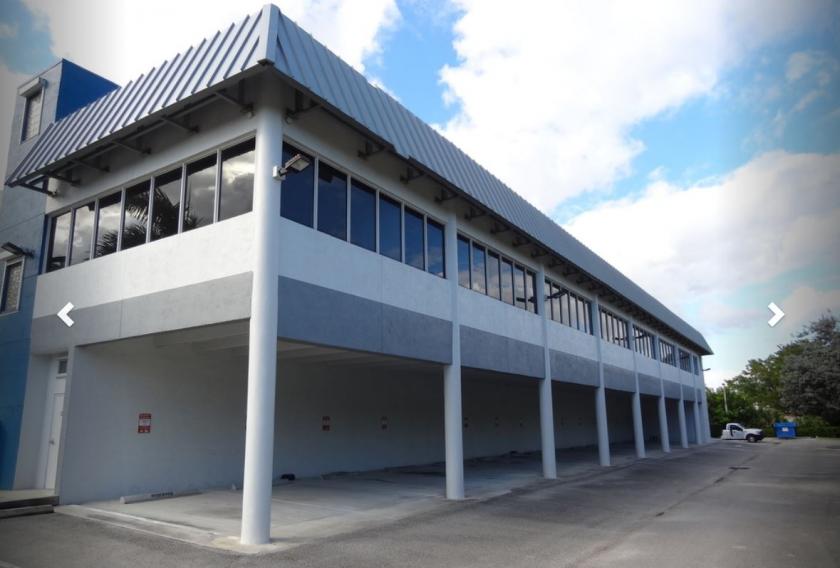
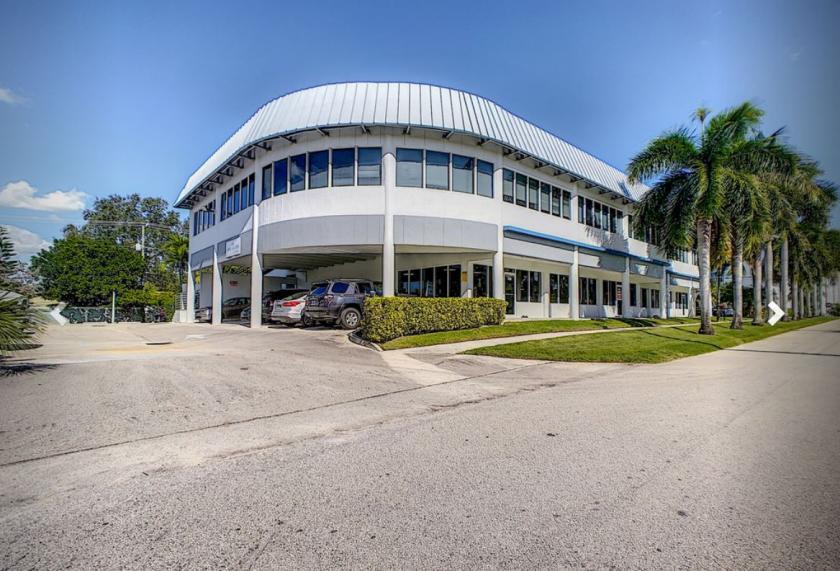
Additional Photos
Listing Agents

Jordan Beck
O: 954-358-0900
M: 954-652-2033
jbeck@bergercommercial.com
O: 954-358-0900
M: 954-652-2033
jbeck@bergercommercial.com
While we strive to provide the most accurate information, all listing information, and demographic data, is provided by third-parties. As such, MyEListing will not be responsible for the accuracy of the information. It is strongly recommended that you verify all information with the listing agent, and any relevant agencies, prior to making any decisions.


