NNN Leased Auto Property
FOR SALE
• Baltimore County location
o Convenient to Owings
Mills Blvd, I-795 and I-695
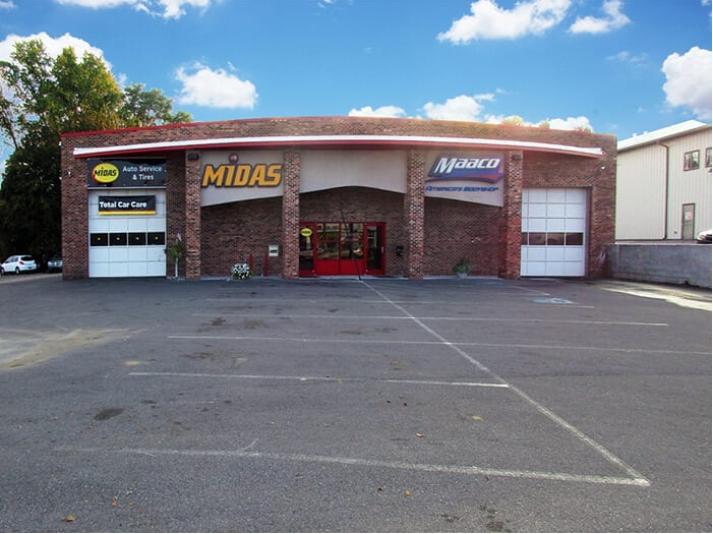
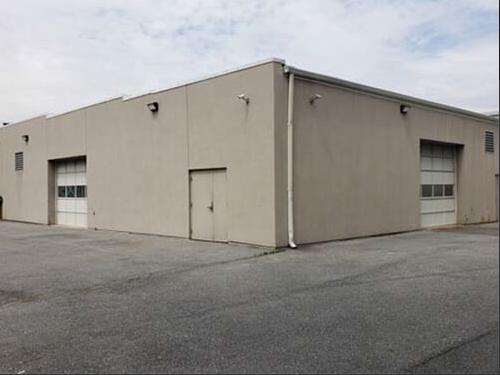
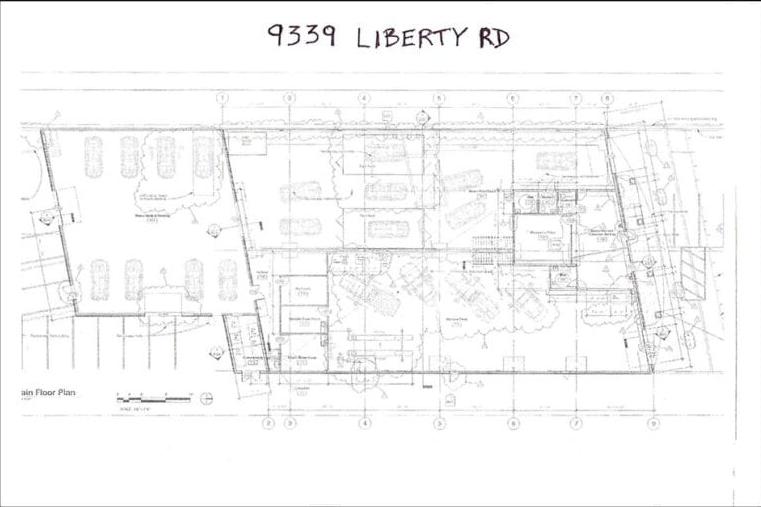
• 17,000 sf building on 1 +/- acre
• Leased to Midas + local tenant
• 6+4 years remaining on leases
• 2 paint booths included
• Drive-through capability
• BR zoning – Business Roadside
• Ideal target for 1031 exchange
No part of this information may be copied, reproduced, repurposed, or screen-captured for any commercial purpose without prior written authorization from MyEListing.
While we strive to provide the most accurate information, all listing information, and demographic data, is provided by third-parties. As such, MyEListing will not be responsible for the accuracy of the information. It is strongly recommended that you verify all information with the listing agent, and any relevant agencies, prior to making any decisions.
What is the building size of this Retail property in Randallstown, MD?
The size of the building/unit at 9339 Liberty Road in Randallstown is 17,000 square feet
What kind of Retail is the propery at 9339 Liberty Road?
The property at 9339 Liberty Road Randallstown, MD 21133 is listed as a Vehicle Sales/Service Retail property
What is the population within 1 mile of 9339 Liberty Road in Randallstown?
The population within 1 mile of 9339 Liberty Road Randallstown, MD 21133 is 13,411 people.
Who do I contact for questions about 9339 Liberty Road?
You should contact the listing agent,
Mitch Gold , for any details regarding this commercial listing.