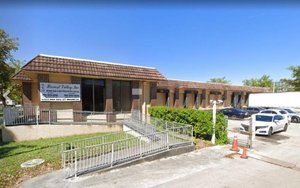
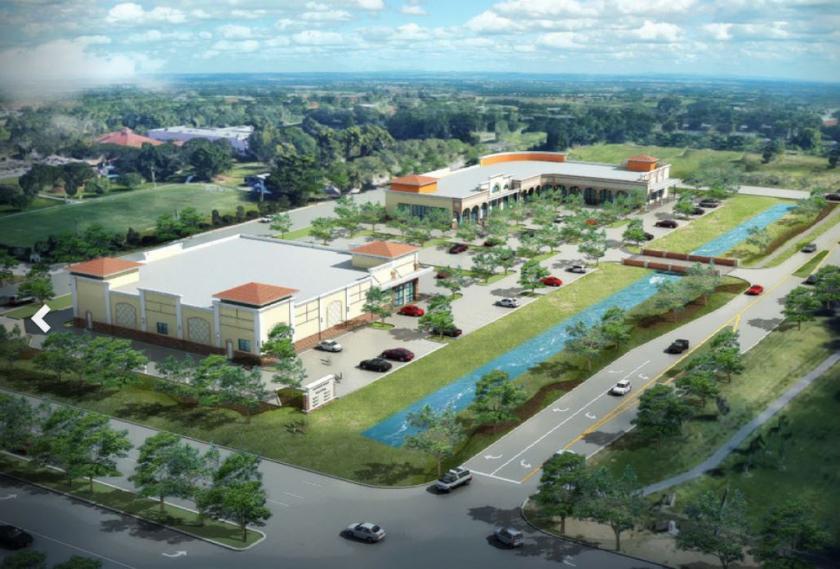
Commercial Land
1380 South Flamingo Road Davie, FL 33325
1380 South Flamingo Road Davie, FL 33325

Details & Description
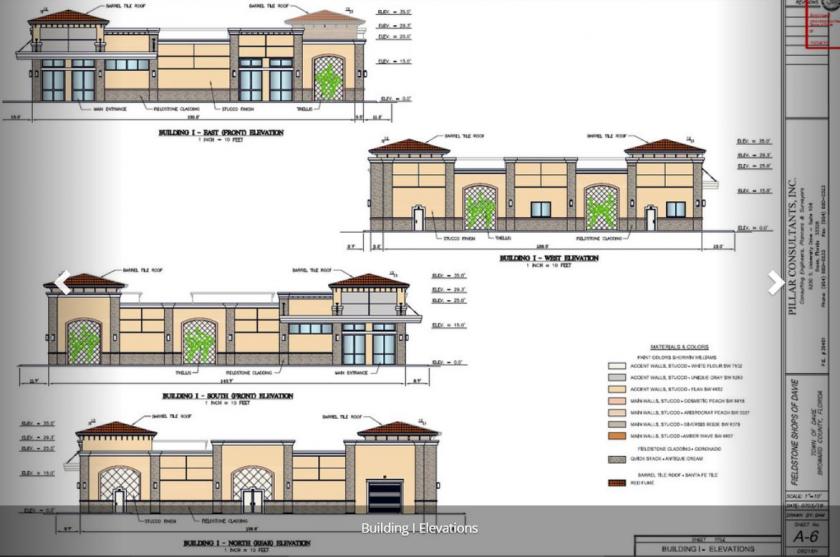
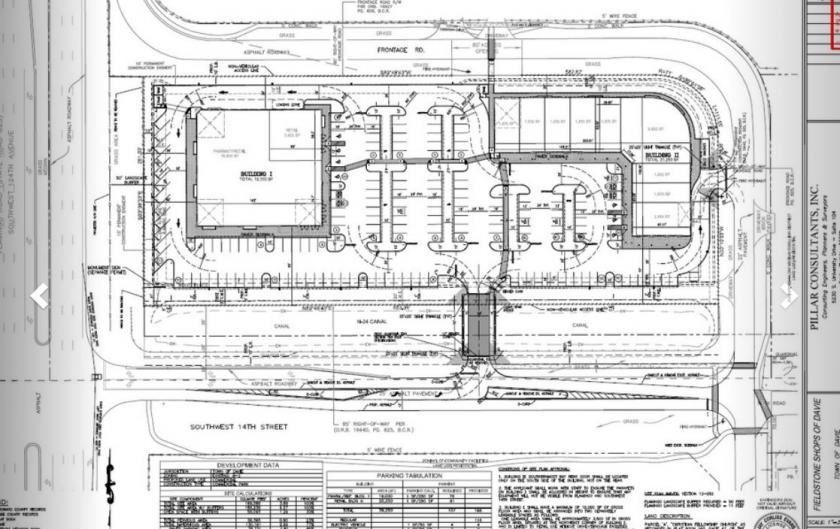
Additional Photos
Listing Agents

Lawrence Oxenberg
O: 954-358-0900
M: 954-652-2017
loxenberg@bergercommercial.com
O: 954-358-0900
M: 954-652-2017
loxenberg@bergercommercial.com
While we strive to provide the most accurate information, all listing information, and demographic data, is provided by third-parties. As such, MyEListing will not be responsible for the accuracy of the information. It is strongly recommended that you verify all information with the listing agent, and any relevant agencies, prior to making any decisions.