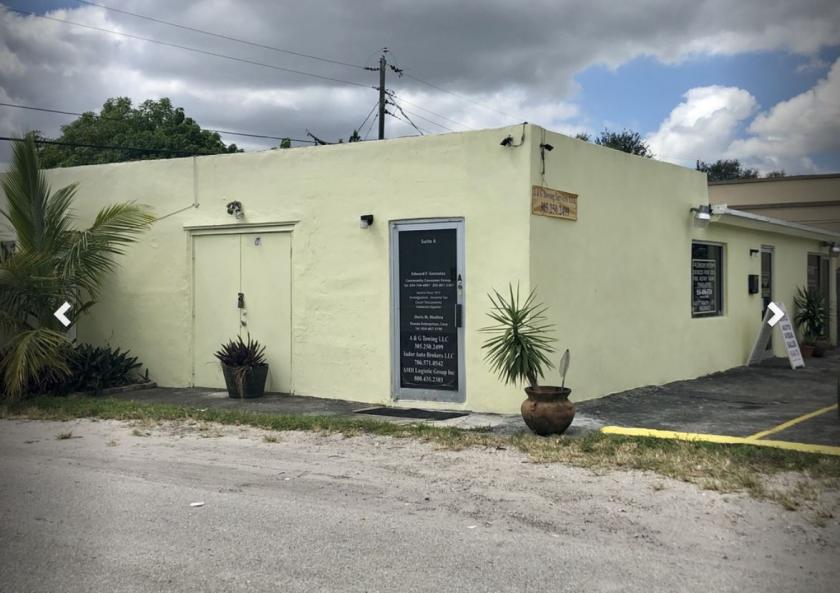
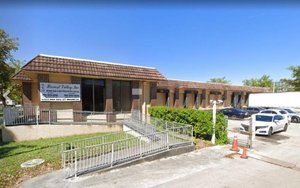
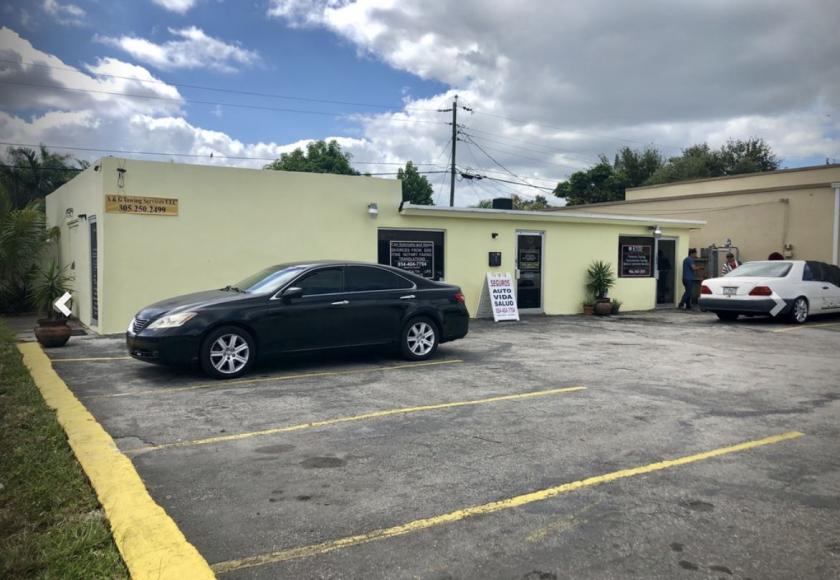
1-Mile | 3-Miles | 5-Miles | ||
---|---|---|---|---|
Total Population | 23,784 | 182,290 | 485,657 | |
Population Median Age | 38 | 38 | 38 | |
Population by Age | 0-9 Yrs | 2537 (10%) | 24048 (13%) | 61657 (12%) |
10-19 Yrs | 3000 (12%) | 21546 (11%) | 56339 (11%) | |
20-29 Yrs | 3418 (14%) | 24260 (13%) | 68529 (14%) | |
30-39 Yrs | 3691 (15%) | 26228 (14%) | 71240 (14%) | |
40-49 Yrs | 3734 (15%) | 24975 (13%) | 68294 (14%) | |
50-59 Yrs | 2734 (11%) | 23495 (12%) | 63726 (13%) | |
60-69 Yrs | 2589 (10%) | 19023 (10%) | 49412 (10%) | |
70+ Yrs | 2082 (8%) | 18714 (10%) | 46459 (9%) | |
Median HH Income | $49,968 | $55,222 | $52,852 | |
Total Household Income | < 24K | 1454 (19%) | 10667 (18%) | 34466 (21%) |
25-49K | 2241 (30%) | 15594 (26%) | 43160 (26%) | |
50-74K | 1762 (23%) | 12078 (20%) | 32715 (20%) | |
75-99K | 729 (9%) | 7821 (13%) | 20767 (12%) | |
100-199K | 883 (11%) | 9237 (15%) | 26264 (16%) | |
200K+ | 317 (4%) | 2811 (4%) | 6076 (3%) | |
Highest Education Level | No Diploma | 3424 | 17951 | 44305 |
Diploma or GED | 6025 | 40116 | 102893 | |
Some College | 3220 | 25248 | 68385 | |
Assoc. Degree | 1543 | 13124 | 36096 | |
Bachelors Degree | 1754 | 18429 | 53705 | |
Higher Degree | 740 | 9929 | 29827 | |
Total Housing Units | 7,961 | 65,162 | 186,427 | |
--Owner-Occupied | 4,130 | 36,508 | 91,463 | |
--Renter-Occupied | 3,256 | 21,699 | 71,984 | |
Owner-Occupied Values | < 100K | 587 | 4385 | 12232 |
100-199K | 1095 | 9839 | 25817 | |
200-299K | 1387 | 11977 | 27366 | |
300-399K | 759 | 6384 | 15619 | |
400-499K | 105 | 1774 | 4656 | |
500K+ | 197 | 2150 | 5772 | |
Total Working Age Population | 19,352 | 145,041 | 390,055 | |
In Work Force | 13,468 | 97,035 | 260,413 | |
Not In Work Force | 5,884 | 48,006 | 129,642 | |
Workforce Employed | 12,322 | 90,867 | 243,476 | |
Workforce Unemployed | 1,138 | 6,136 | 16,709 | |
Civlian Workforce | 13,459 | 97,003 | 260,186 | |
Military Workforce | 9 | 31 | 228 | |
Total Households | 7,385 | 58,208 | 163,447 | |
Family Households | 5,309 | 40,902 | 107,201 | |
Non-Family Households | 2,077 | 17,306 | 56,246 | |
Married Couple | 3,047 | 25,347 | 64,245 | |
Other Family | 2,262 | 15,555 | 42,956 | |
Married w/Child | 1,258 | 10,609 | 25,651 | |
Single Male w/Child | 285 | 2,002 | 4,606 | |
Single Female w/Child | 641 | 5,178 | 14,931 |
Population Change Last Two Decades - Plus Projection
2000 | % | 2010 | % | 2020 | % | 2030 | |
---|---|---|---|---|---|---|---|
Florida | 15,982,378 | +18 | 18,801,310 | +14 | 21,517,610 | +13 | 24,340,457 |
Broward County | 1,623,018 | +8 | 1,748,066 | +11 | 1,942,686 | +9 | 2,120,334 |
Miami-Dade County | 2,253,362 | +11 | 2,496,435 | +15 | 2,861,579 | +11 | 3,190,242 |
Total Working Age Population:
Total Households:
Total Working Age Population:
Total Households:
Total Working Age Population:
Total Households: