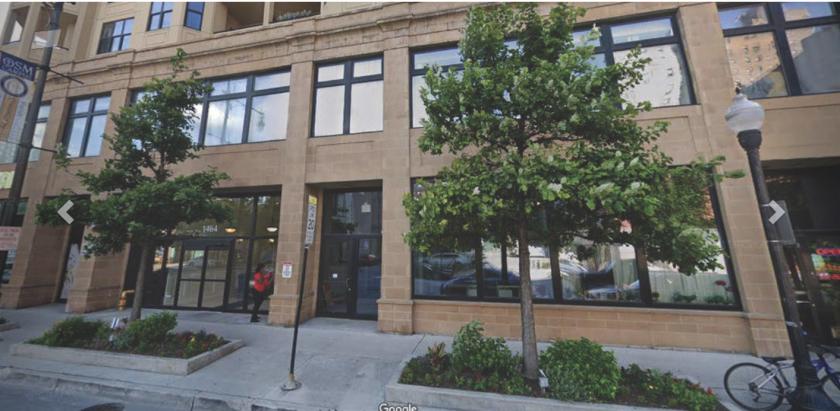
1-Mile | 3-Miles | 5-Miles | ||
---|---|---|---|---|
Total Population | 49,473 | 347,892 | 793,966 | |
Population Median Age | 38 | 38 | 36 | |
Population by Age | 0-9 Yrs | 3410 (6%) | 25955 (7%) | 76507 (9%) |
10-19 Yrs | 3556 (7%) | 25938 (7%) | 71379 (8%) | |
20-29 Yrs | 10422 (21%) | 80532 (23%) | 185423 (23%) | |
30-39 Yrs | 11911 (24%) | 75179 (21%) | 161274 (20%) | |
40-49 Yrs | 6182 (12%) | 39706 (11%) | 90717 (11%) | |
50-59 Yrs | 6462 (13%) | 38331 (11%) | 80058 (10%) | |
60-69 Yrs | 4032 (8%) | 36208 (10%) | 72367 (9%) | |
70+ Yrs | 3497 (7%) | 26043 (7%) | 56241 (7%) | |
Median HH Income | $102,161 | $91,032 | $75,616 | |
Total Household Income | < 24K | 4815 (18%) | 34507 (19%) | 80036 (21%) |
25-49K | 2107 (7%) | 20197 (11%) | 53767 (14%) | |
50-74K | 2951 (11%) | 21756 (12%) | 47653 (13%) | |
75-99K | 3153 (11%) | 19532 (10%) | 39527 (10%) | |
100-199K | 8412 (31%) | 48469 (27%) | 88800 (24%) | |
200K+ | 5047 (19%) | 33512 (18%) | 55080 (15%) | |
Highest Education Level | No Diploma | 2464 | 21471 | 66349 |
Diploma or GED | 2889 | 28118 | 84509 | |
Some College | 3981 | 29957 | 69302 | |
Assoc. Degree | 1580 | 8919 | 22486 | |
Bachelors Degree | 12272 | 89592 | 177480 | |
Higher Degree | 16088 | 89163 | 156221 | |
Total Housing Units | 29,381 | 204,507 | 417,319 | |
--Owner-Occupied | 12,347 | 68,990 | 135,433 | |
--Renter-Occupied | 14,139 | 108,981 | 229,429 | |
Owner-Occupied Values | < 100K | 204 | 1825 | 6430 |
100-199K | 489 | 4536 | 18414 | |
200-299K | 2357 | 12678 | 24890 | |
300-399K | 3707 | 14293 | 22486 | |
400-499K | 2226 | 10780 | 17628 | |
500K+ | 3363 | 24879 | 45584 | |
Total Working Age Population | 44,524 | 310,107 | 679,387 | |
In Work Force | 33,098 | 221,940 | 471,071 | |
Not In Work Force | 11,427 | 88,167 | 208,317 | |
Workforce Employed | 32,041 | 211,128 | 442,200 | |
Workforce Unemployed | 910 | 10,573 | 28,416 | |
Civlian Workforce | 32,951 | 221,700 | 470,616 | |
Military Workforce | 147 | 239 | 455 | |
Total Households | 26,486 | 177,971 | 364,862 | |
Family Households | 10,534 | 69,900 | 154,789 | |
Non-Family Households | 15,952 | 108,071 | 210,073 | |
Married Couple | 8,428 | 52,554 | 103,711 | |
Other Family | 2,106 | 17,346 | 51,078 | |
Married w/Child | 2,211 | 14,597 | 35,406 | |
Single Male w/Child | 70 | 1,224 | 4,593 | |
Single Female w/Child | 896 | 6,062 | 19,448 |
Population Change Last Two Decades - Plus Projection
2000 | % | 2010 | % | 2020 | % | 2030 | |
---|---|---|---|---|---|---|---|
Illinois | 12,419,293 | +3 | 12,830,632 | +12 | 14,316,487 | +6 | 15,138,849 |
Cook County | 5,376,741 | -3 | 5,194,675 | +10 | 5,707,832 | +5 | 5,990,243 |
Total Working Age Population:
Total Households:
Total Working Age Population:
Total Households:
Total Working Age Population:
Total Households: