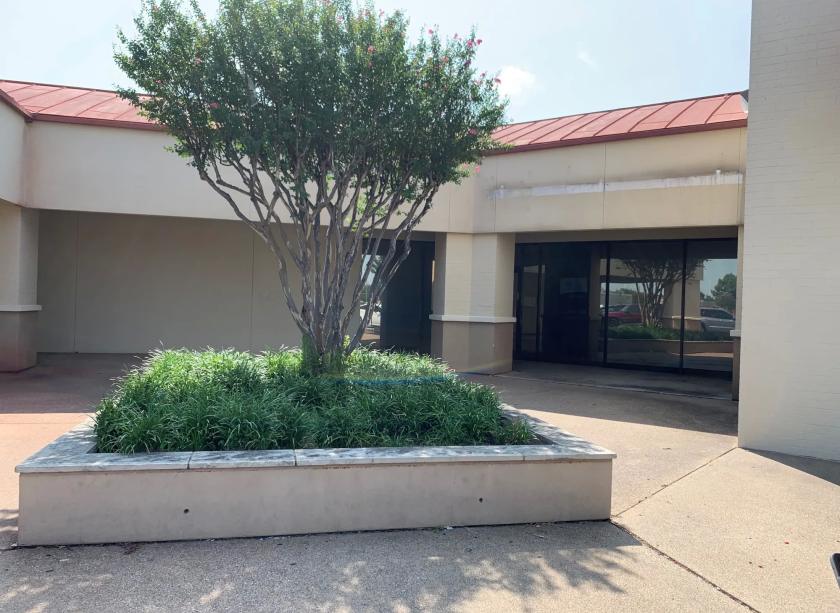
Retail Space
1235 South Josey Lane Carrollton, TX 75006
1235 South Josey Lane Carrollton, TX 75006
Details & Description
Property Highlights
- • Carrollton Park Shopping Center (119, 280 SF)
- • Traffic Count of 26,324 ADV (Source: CoStar)
- • Easy Access from I-35 & President George Bush
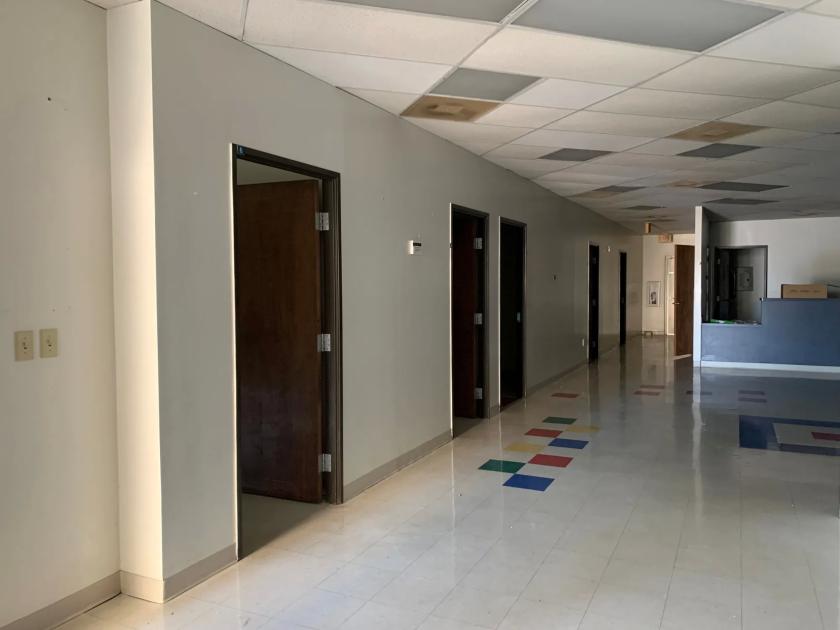
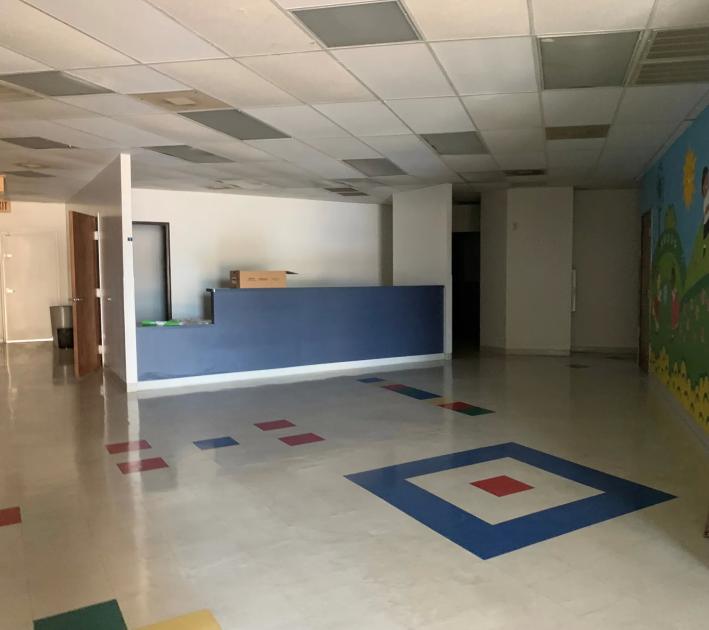
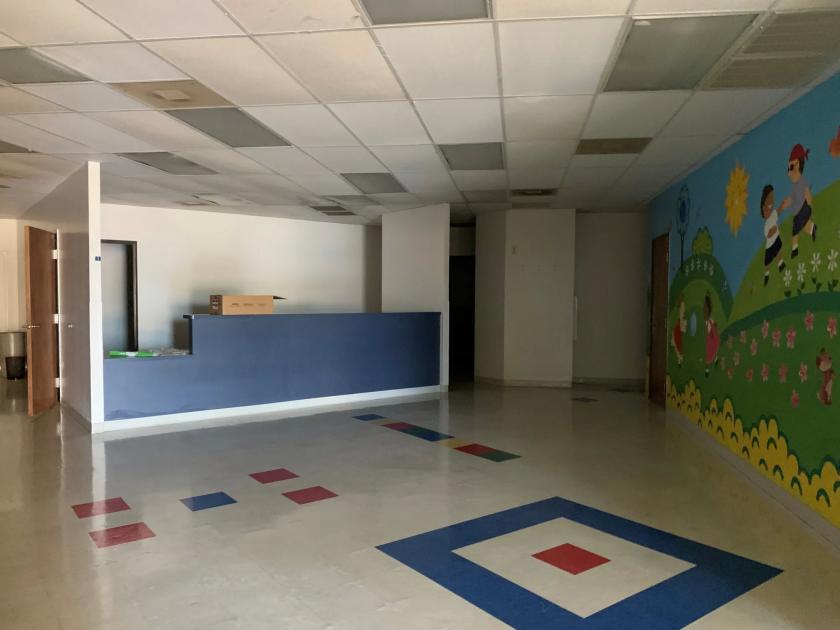
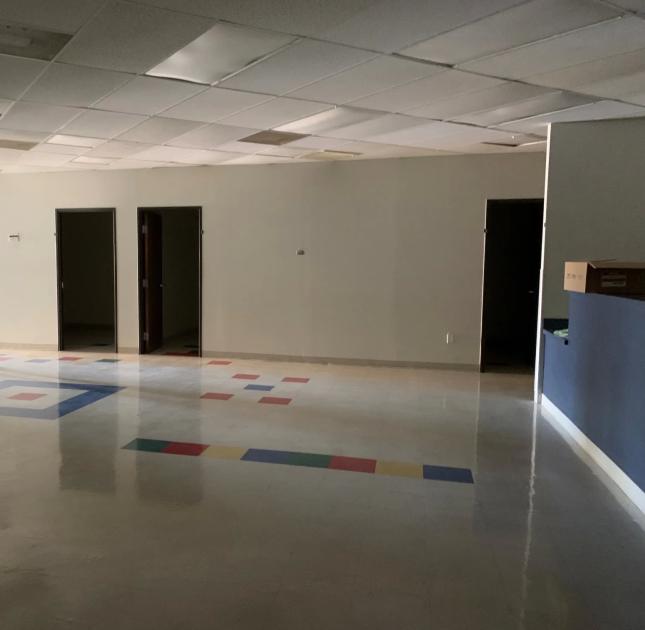
- • 3000 SF - 2nd Generation Space
Additional Photos
Listing Agents

Elizabeth Ocando
O: 214-389-3666
M: 678-925-8271
ocando@hudsonpeters.com
O: 214-389-3666
M: 678-925-8271
ocando@hudsonpeters.com
While we strive to provide the most accurate information, all listing information, and demographic data, is provided by third-parties. As such, MyEListing will not be responsible for the accuracy of the information. It is strongly recommended that you verify all information with the listing agent, and any relevant agencies, prior to making any decisions.


