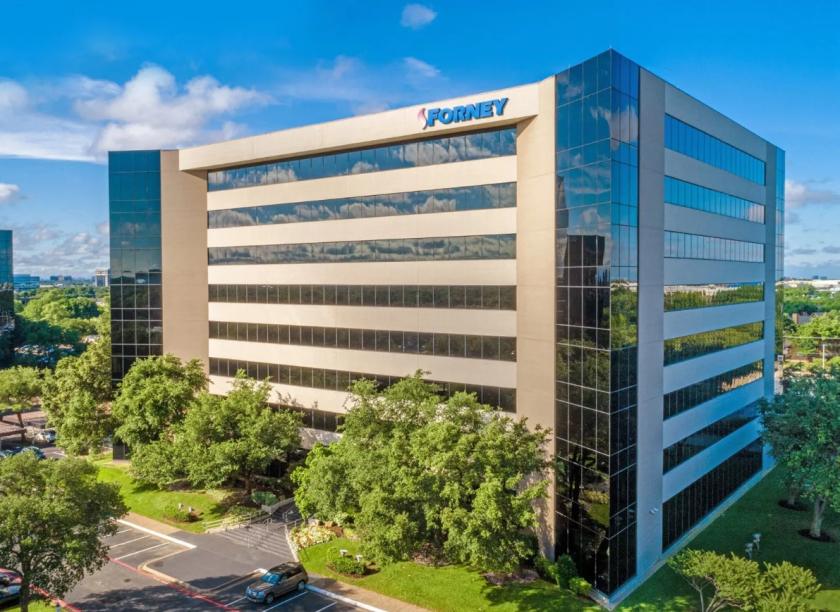
Office Space
16479 Dallas Parkway Addison, TX 75001
16479 Dallas Parkway Addison, TX 75001
Details & Description
Property Highlights
- • Move-in Ready Spec Suites
- • Full Floor Availability
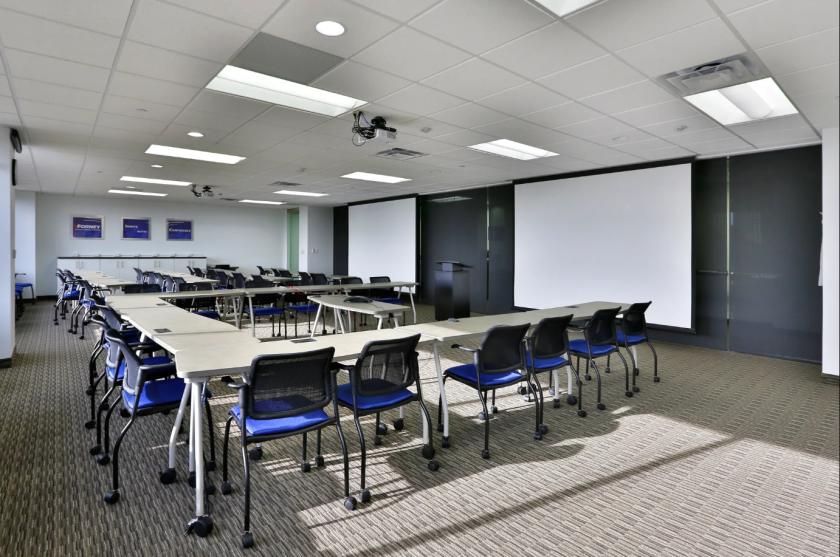
- • 30 Person Conference Center
- • On-site Security
- • Easy In/Out Via Westgrove and DNT Access Road
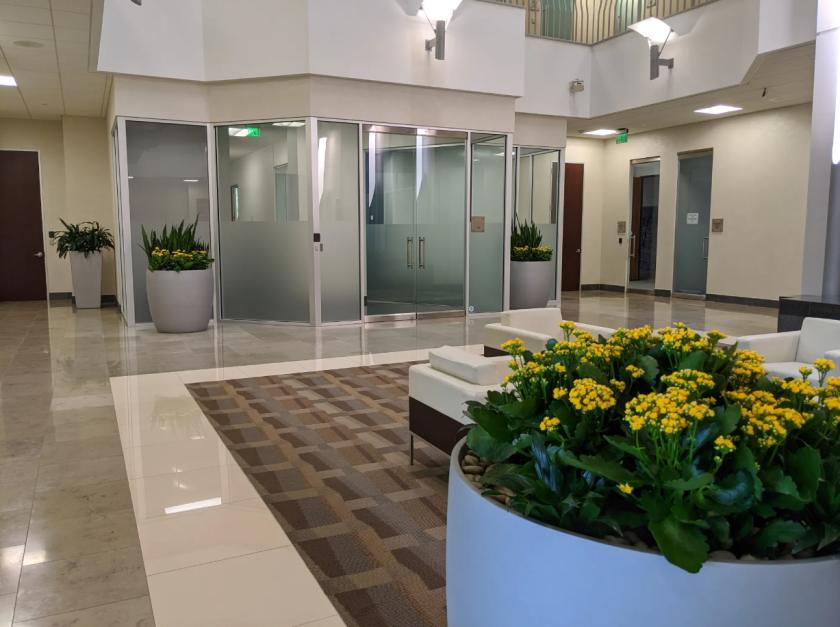
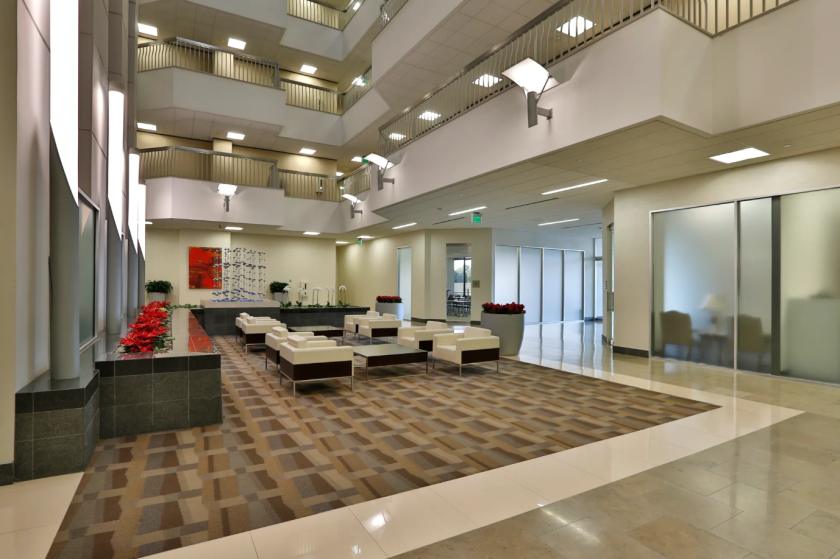
Additional Photos
Listing Agents

Michelle Hudson
O: 214-389-3663
M: 214-534-0226
Hudson@HudsonPeters.com
O: 214-389-3663
M: 214-534-0226
Hudson@HudsonPeters.com

Janice Peters
O: 214-389-3664
M: 214-538-8393
Peters@HudsonPeters.com
O: 214-389-3664
M: 214-538-8393
Peters@HudsonPeters.com

Tom Hudson
Hudson Peters Commercial
O: 214-389-3667
M: 214-389-3667
tom@hudsonpeters.com
Hudson Peters Commercial
O: 214-389-3667
M: 214-389-3667
tom@hudsonpeters.com
While we strive to provide the most accurate information, all listing information, and demographic data, is provided by third-parties. As such, MyEListing will not be responsible for the accuracy of the information. It is strongly recommended that you verify all information with the listing agent, and any relevant agencies, prior to making any decisions.


