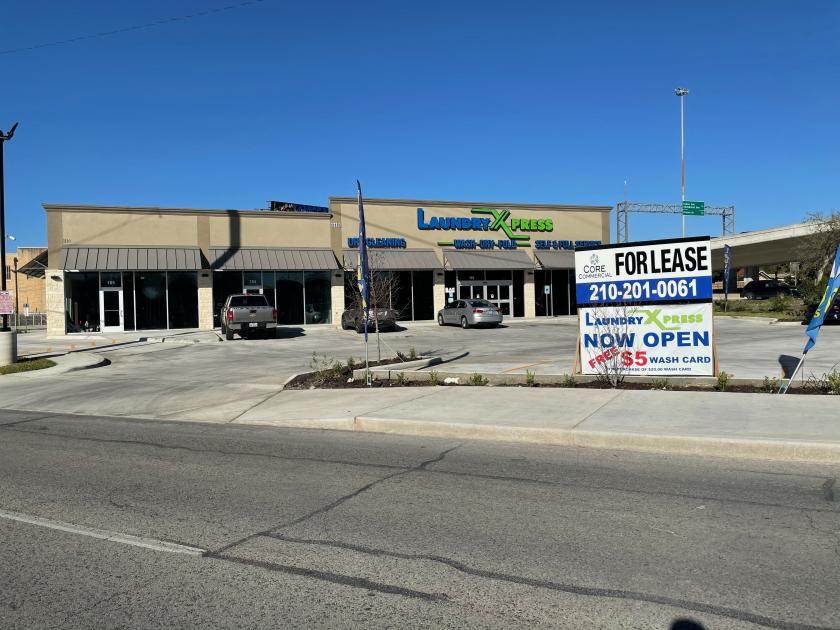
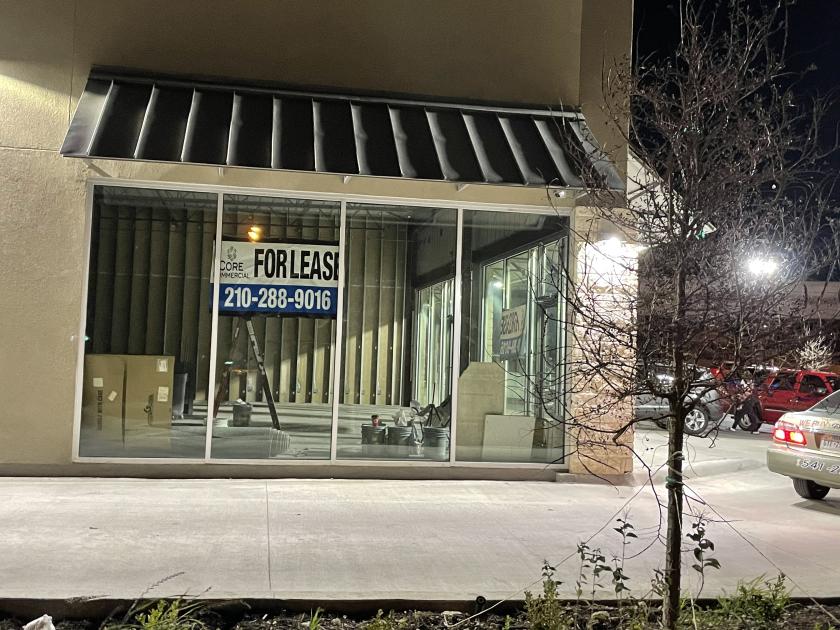
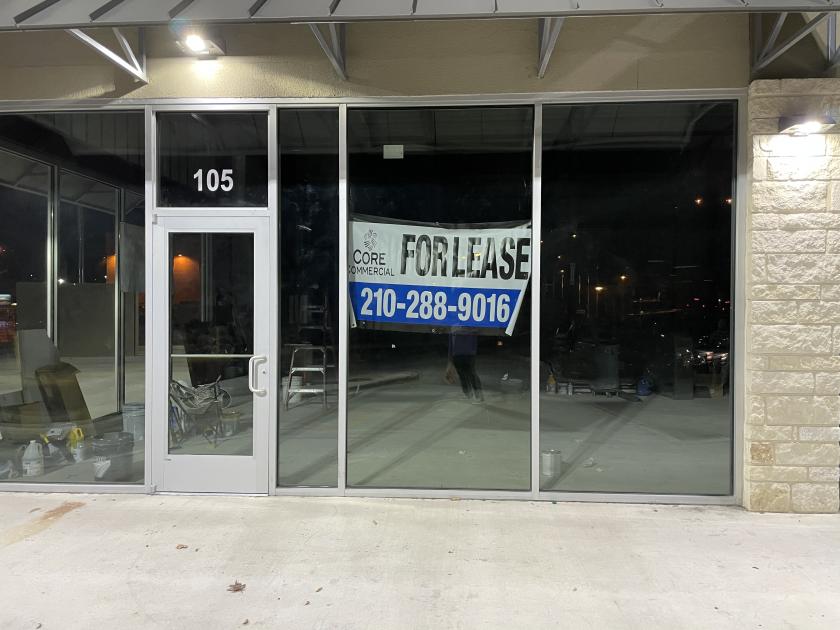
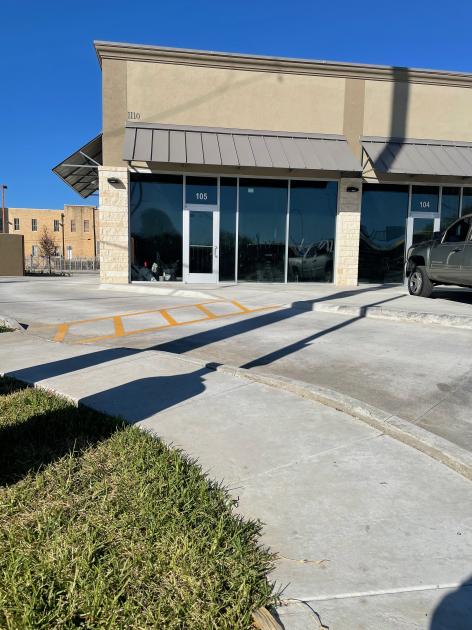
1-Mile | 3-Miles | 5-Miles | ||
---|---|---|---|---|
Total Population | 20,892 | 161,028 | 404,982 | |
Population Median Age | 38 | 38 | 37 | |
Population by Age | 0-9 Yrs | 2362 (11%) | 18665 (11%) | 53914 (13%) |
10-19 Yrs | 2709 (12%) | 21401 (13%) | 55579 (13%) | |
20-29 Yrs | 3132 (14%) | 26335 (16%) | 61936 (15%) | |
30-39 Yrs | 3186 (15%) | 22109 (13%) | 57526 (14%) | |
40-49 Yrs | 2874 (13%) | 20567 (12%) | 50216 (12%) | |
50-59 Yrs | 2775 (13%) | 19515 (12%) | 49194 (12%) | |
60-69 Yrs | 1932 (9%) | 16148 (10%) | 38297 (9%) | |
70+ Yrs | 1923 (9%) | 16289 (10%) | 38320 (9%) | |
Median HH Income | $43,061 | $38,628 | $40,126 | |
Total Household Income | < 24K | 2223 (31%) | 18073 (34%) | 43354 (32%) |
25-49K | 1826 (26%) | 14153 (26%) | 35146 (26%) | |
50-74K | 1196 (17%) | 8935 (16%) | 22576 (16%) | |
75-99K | 784 (11%) | 4573 (8%) | 12533 (9%) | |
100-199K | 818 (11%) | 5767 (10%) | 14475 (10%) | |
200K+ | 129 (1%) | 1610 (3%) | 5595 (4%) | |
Highest Education Level | No Diploma | 3742 | 33577 | 73374 |
Diploma or GED | 4184 | 31053 | 75467 | |
Some College | 3025 | 19161 | 51493 | |
Assoc. Degree | 701 | 4960 | 13525 | |
Bachelors Degree | 1901 | 12008 | 32197 | |
Higher Degree | 1106 | 7687 | 20052 | |
Total Housing Units | 8,091 | 60,685 | 150,960 | |
--Owner-Occupied | 3,853 | 25,786 | 66,940 | |
--Renter-Occupied | 3,122 | 27,325 | 66,739 | |
Owner-Occupied Values | < 100K | 1491 | 13467 | 33529 |
100-199K | 1600 | 7801 | 18724 | |
200-299K | 540 | 1937 | 5582 | |
300-399K | 171 | 904 | 2680 | |
400-499K | 23 | 489 | 1695 | |
500K+ | 28 | 1189 | 4730 | |
Total Working Age Population | 17,071 | 131,445 | 319,004 | |
In Work Force | 10,579 | 76,293 | 187,991 | |
Not In Work Force | 6,493 | 55,152 | 131,013 | |
Workforce Employed | 9,993 | 71,424 | 175,699 | |
Workforce Unemployed | 574 | 4,508 | 10,731 | |
Civlian Workforce | 10,567 | 75,932 | 186,431 | |
Military Workforce | 12 | 361 | 1,561 | |
Total Households | 6,975 | 53,112 | 133,678 | |
Family Households | 4,117 | 30,369 | 79,969 | |
Non-Family Households | 2,857 | 22,743 | 53,709 | |
Married Couple | 2,657 | 18,146 | 47,383 | |
Other Family | 1,460 | 12,223 | 32,586 | |
Married w/Child | 966 | 6,480 | 17,948 | |
Single Male w/Child | 151 | 762 | 2,339 | |
Single Female w/Child | 410 | 4,438 | 12,712 |
Population Change Last Two Decades - Plus Projection
2000 | % | 2010 | % | 2020 | % | 2030 | |
---|---|---|---|---|---|---|---|
Texas | 20,851,820 | +21 | 25,145,561 | +18 | 29,677,668 | +18 | 34,894,452 |
Bexar County | 1,392,931 | +23 | 1,714,773 | +22 | 2,093,502 | +20 | 2,502,617 |
Total Working Age Population:
Total Households:
Total Working Age Population:
Total Households:
Total Working Age Population:
Total Households: