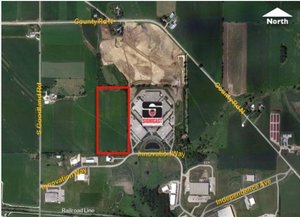
1-Mile | 3-Miles | 5-Miles | ||
---|---|---|---|---|
Total Population | 1,032 | 15,606 | 28,915 | |
Population Median Age | 43 | 43 | 43 | |
Population by Age | 0-9 Yrs | 100 (9%) | 1719 (11%) | 2936 (10%) |
10-19 Yrs | 135 (13%) | 1654 (10%) | 3087 (10%) | |
20-29 Yrs | 77 (7%) | 1806 (11%) | 3342 (11%) | |
30-39 Yrs | 158 (15%) | 2013 (12%) | 3412 (11%) | |
40-49 Yrs | 100 (9%) | 1687 (10%) | 3466 (11%) | |
50-59 Yrs | 143 (13%) | 2173 (13%) | 4193 (14%) | |
60-69 Yrs | 174 (16%) | 2359 (15%) | 4292 (14%) | |
70+ Yrs | 146 (14%) | 2197 (14%) | 4186 (14%) | |
Median HH Income | $38,671 | $43,619 | $45,157 | |
Total Household Income | < 24K | 164 (33%) | 2206 (29%) | 4007 (29%) |
25-49K | 132 (27%) | 1936 (26%) | 3485 (25%) | |
50-74K | 73 (14%) | 1325 (18%) | 2772 (20%) | |
75-99K | 71 (14%) | 899 (12%) | 1586 (11%) | |
100-199K | 43 (8%) | 821 (11%) | 1586 (11%) | |
200K+ | 5 (1%) | 167 (2%) | 362 (2%) | |
Highest Education Level | No Diploma | 91 | 981 | 1769 |
Diploma or GED | 333 | 4449 | 8488 | |
Some College | 182 | 2769 | 5389 | |
Assoc. Degree | 69 | 1218 | 2078 | |
Bachelors Degree | 81 | 1391 | 2585 | |
Higher Degree | 18 | 670 | 1229 | |
Total Housing Units | 537 | 8,214 | 15,477 | |
--Owner-Occupied | 371 | 4,550 | 8,876 | |
--Renter-Occupied | 117 | 2,804 | 4,921 | |
Owner-Occupied Values | < 100K | 238 | 2720 | 5115 |
100-199K | 77 | 1207 | 2394 | |
200-299K | 14 | 354 | 842 | |
300-399K | 5 | 120 | 289 | |
400-499K | 27 | 105 | 138 | |
500K+ | 9 | 44 | 99 | |
Total Working Age Population | 829 | 12,894 | 24,225 | |
In Work Force | 418 | 7,724 | 14,926 | |
Not In Work Force | 411 | 5,170 | 9,298 | |
Workforce Employed | 407 | 7,448 | 14,257 | |
Workforce Unemployed | 11 | 275 | 664 | |
Civlian Workforce | 418 | 7,723 | 14,922 | |
Military Workforce | 0 | 1 | 4 | |
Total Households | 488 | 7,354 | 13,797 | |
Family Households | 287 | 3,981 | 7,427 | |
Non-Family Households | 201 | 3,373 | 6,370 | |
Married Couple | 179 | 2,869 | 5,396 | |
Other Family | 108 | 1,112 | 2,031 | |
Married w/Child | 39 | 833 | 1,582 | |
Single Male w/Child | 7 | 251 | 566 | |
Single Female w/Child | 61 | 466 | 778 |
Population Change Last Two Decades - Plus Projection
2000 | % | 2010 | % | 2020 | % | 2030 | |
---|---|---|---|---|---|---|---|
Michigan | 9,938,444 | -1 | 9,883,640 | +1 | 10,023,423 | +4 | 10,424,510 |
Menominee County | 25,326 | -5 | 24,029 | -6 | 22,627 | -3 | 21,947 |
Wisconsin | 5,363,675 | +6 | 5,686,986 | +6 | 6,005,080 | +6 | 6,375,910 |
Door County | 27,961 | -1 | 27,785 | 0 | 27,890 | +2 | 28,365 |
Marinette County | 43,384 | -4 | 41,749 | 0 | 41,925 | +4 | 43,400 |
Oconto County | 35,634 | +6 | 37,660 | +8 | 40,620 | +10 | 44,850 |
Total Working Age Population:
Total Households:
Total Working Age Population:
Total Households:
Total Working Age Population:
Total Households: