Commercial Land
5057 Transit Road Lancaster, NY 14086
5057 Transit Road Lancaster, NY 14086
Details & Description
Property Highlights
• One of a few remaining buildable vacant land sites in this market
• Expandable Up To a Total of 5 - Acres of Vacant Land
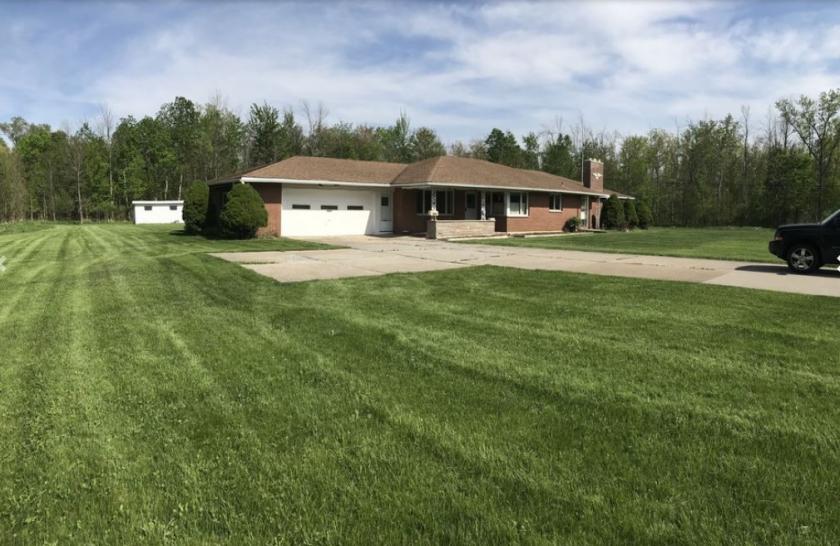
Additional Photos
Listing Agents

Rick Recckio
O: 716-631-5555
M: 716-998-4422
rick@recckio.com
O: 716-631-5555
M: 716-998-4422
rick@recckio.com
While we strive to provide the most accurate information, all listing information, and demographic data, is provided by third-parties. As such, MyEListing will not be responsible for the accuracy of the information. It is strongly recommended that you verify all information with the listing agent, and any relevant agencies, prior to making any decisions.