Features
• The Property is currently located in the Town of Wilson and will need to be annexed into the City of Sheboygan for sewer, natural gas, and water.
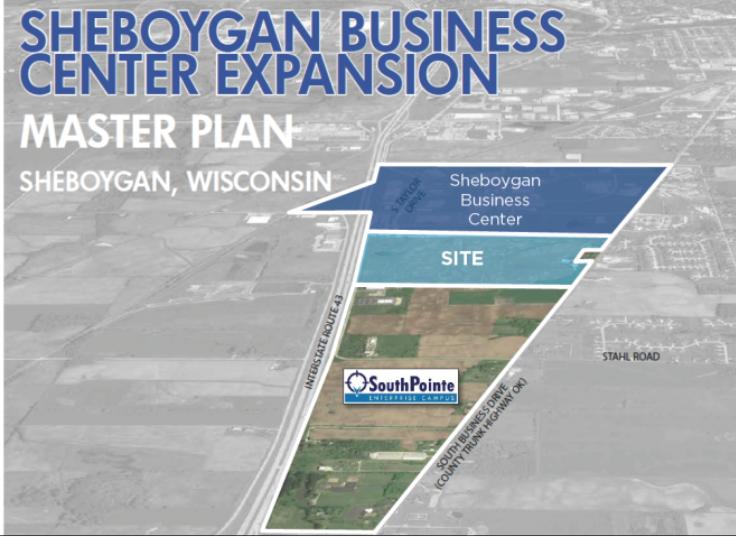
• Phase II land for the City of Sheboygan’s Master Planned SouthPointe Enterprise Campus.
SouthPointe Enterprise Campus
•Aesthetic 400-acre business park for office and large-scale industrial users
•Great visibility and access off of Interstate 43
•Within an hour drive of Milwaukee, the Fox Valley, and Green Bay
•Multi-use trails throughout for employee enjoyment and Green Infrastructure bioswales
Basic Details
Property Type :Land
Listing Type :For Sale
Price :$4.950.000
Lot Area :124.19 Acre
Availability Status :Available
No part of this information may be copied, reproduced, repurposed, or screen-captured for any commercial purpose without prior written authorization from MyEListing.
While we strive to provide the most accurate information, all listing information, and demographic data, is provided by third-parties. As such, MyEListing will not be responsible for the accuracy of the information. It is strongly recommended that you verify all information with the listing agent, and any relevant agencies, prior to making any decisions.
What is the asking price for 5223 S Business Dr in Sheboygan?
The asking price for 5223 S Business Dr is $4,950,000
How much land does the Sheboygan, WI property at 5223 S Business Dr include?
5223 S Business Dr in Sheboygan includes 124.190 acres of land
What kind of Land is the propery at 5223 S Business Dr?
The property at 5223 S Business Dr Sheboygan, WI 53081 is listed as a Office Land Land property
What is the population within 1 mile of 5223 S Business Dr in Sheboygan?
The population within 1 mile of 5223 S Business Dr Sheboygan, WI 53081 is 1,398 people.
Who do I contact for questions about 5223 S Business Dr?
You should contact the listing agent,
Jack Price, for any details regarding this commercial listing.