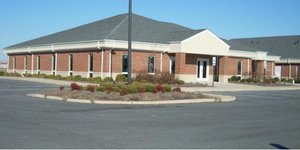
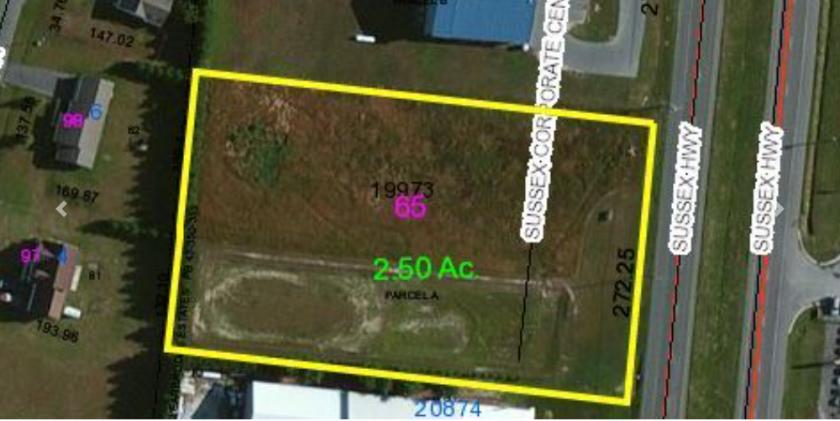
1-Mile | 3-Miles | 5-Miles | ||
---|---|---|---|---|
Total Population | 2,775 | 15,907 | 27,044 | |
Population Median Age | 41 | 42 | 41 | |
Population by Age | 0-9 Yrs | 339 (12%) | 1846 (11%) | 3305 (12%) |
10-19 Yrs | 372 (13%) | 1953 (12%) | 3397 (12%) | |
20-29 Yrs | 351 (12%) | 1768 (11%) | 3167 (11%) | |
30-39 Yrs | 266 (9%) | 1885 (11%) | 3226 (11%) | |
40-49 Yrs | 346 (12%) | 1727 (10%) | 2806 (10%) | |
50-59 Yrs | 326 (11%) | 2363 (14%) | 3898 (14%) | |
60-69 Yrs | 335 (12%) | 2148 (13%) | 3647 (13%) | |
70+ Yrs | 440 (15%) | 2217 (13%) | 3598 (13%) | |
Median HH Income | $47,640 | $55,918 | $53,953 | |
Total Household Income | < 24K | 362 (32%) | 1365 (22%) | 2239 (21%) |
25-49K | 210 (19%) | 1394 (22%) | 2510 (24%) | |
50-74K | 204 (18%) | 1050 (17%) | 1817 (17%) | |
75-99K | 72 (6%) | 741 (12%) | 1199 (11%) | |
100-199K | 221 (20%) | 1455 (23%) | 2230 (21%) | |
200K+ | 30 (2%) | 165 (2%) | 258 (2%) | |
Highest Education Level | No Diploma | 309 | 1754 | 3265 |
Diploma or GED | 731 | 3750 | 6329 | |
Some College | 398 | 2459 | 3856 | |
Assoc. Degree | 179 | 1123 | 1920 | |
Bachelors Degree | 193 | 1282 | 2100 | |
Higher Degree | 128 | 870 | 1339 | |
Total Housing Units | 1,180 | 6,788 | 11,293 | |
--Owner-Occupied | 582 | 4,325 | 7,416 | |
--Renter-Occupied | 518 | 1,845 | 2,837 | |
Owner-Occupied Values | < 100K | 76 | 533 | 1154 |
100-199K | 257 | 1777 | 2772 | |
200-299K | 169 | 1478 | 2402 | |
300-399K | 36 | 263 | 618 | |
400-499K | 29 | 182 | 313 | |
500K+ | 15 | 92 | 157 | |
Total Working Age Population | 2,158 | 12,873 | 21,598 | |
In Work Force | 1,254 | 8,023 | 13,036 | |
Not In Work Force | 904 | 4,850 | 8,562 | |
Workforce Employed | 1,167 | 7,587 | 12,289 | |
Workforce Unemployed | 87 | 429 | 738 | |
Civlian Workforce | 1,254 | 8,016 | 13,027 | |
Military Workforce | 0 | 6 | 9 | |
Total Households | 1,099 | 6,170 | 10,253 | |
Family Households | 703 | 4,251 | 7,119 | |
Non-Family Households | 397 | 1,919 | 3,134 | |
Married Couple | 427 | 2,984 | 5,102 | |
Other Family | 275 | 1,267 | 2,017 | |
Married w/Child | 168 | 951 | 1,602 | |
Single Male w/Child | 1 | 49 | 114 | |
Single Female w/Child | 125 | 512 | 843 |
Population Change Last Two Decades - Plus Projection
2000 | % | 2010 | % | 2020 | % | 2030 | |
---|---|---|---|---|---|---|---|
Delaware | 783,600 | +15 | 897,934 | +10 | 989,803 | +6 | 1,044,965 |
Sussex County | 156,638 | +26 | 197,145 | +19 | 235,396 | +8 | 255,143 |
Total Working Age Population:
Total Households:
Total Working Age Population:
Total Households:
Total Working Age Population:
Total Households: