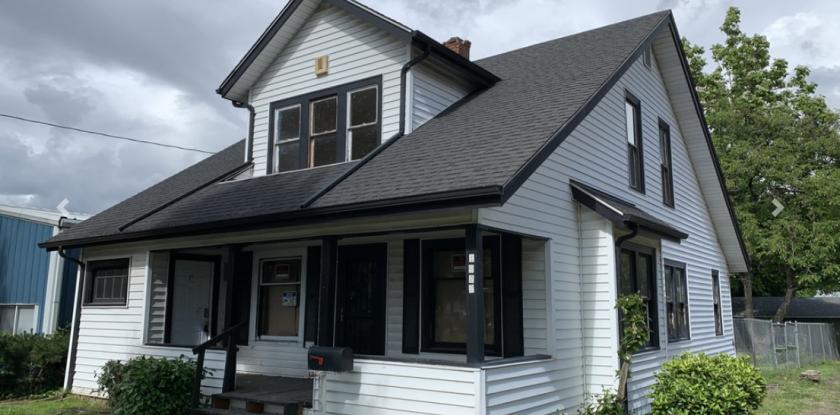
1-Mile | 3-Miles | 5-Miles | ||
---|---|---|---|---|
Total Population | 10,921 | 111,835 | 213,670 | |
Population Median Age | 37 | 36 | 37 | |
Population by Age | 0-9 Yrs | 1118 (10%) | 14475 (12%) | 28135 (13%) |
10-19 Yrs | 1549 (14%) | 16154 (14%) | 29674 (13%) | |
20-29 Yrs | 2027 (18%) | 18044 (16%) | 32351 (15%) | |
30-39 Yrs | 1571 (14%) | 15887 (14%) | 30059 (14%) | |
40-49 Yrs | 1417 (12%) | 14474 (12%) | 25706 (12%) | |
50-59 Yrs | 1279 (11%) | 12493 (11%) | 24080 (11%) | |
60-69 Yrs | 1284 (11%) | 11673 (10%) | 23881 (11%) | |
70+ Yrs | 675 (6%) | 8635 (7%) | 19786 (9%) | |
Median HH Income | $43,329 | $48,872 | $55,759 | |
Total Household Income | < 24K | 1209 (27%) | 9518 (23%) | 15267 (20%) |
25-49K | 1279 (29%) | 11018 (27%) | 19080 (25%) | |
50-74K | 755 (17%) | 7596 (18%) | 15127 (19%) | |
75-99K | 445 (10%) | 4709 (11%) | 10316 (13%) | |
100-199K | 582 (13%) | 6221 (15%) | 14171 (18%) | |
200K+ | 101 (2%) | 1071 (2%) | 2330 (3%) | |
Highest Education Level | No Diploma | 1376 | 11804 | 21125 |
Diploma or GED | 1580 | 18573 | 35631 | |
Some College | 1881 | 19325 | 37400 | |
Assoc. Degree | 581 | 6082 | 11879 | |
Bachelors Degree | 1232 | 10217 | 21247 | |
Higher Degree | 594 | 6181 | 12241 | |
Total Housing Units | 4,781 | 43,129 | 81,334 | |
--Owner-Occupied | 1,481 | 18,101 | 40,943 | |
--Renter-Occupied | 2,891 | 22,032 | 35,348 | |
Owner-Occupied Values | < 100K | 116 | 988 | 3647 |
100-199K | 755 | 6055 | 11498 | |
200-299K | 439 | 7260 | 15597 | |
300-399K | 78 | 2467 | 6581 | |
400-499K | 33 | 809 | 2091 | |
500K+ | 61 | 522 | 1530 | |
Total Working Age Population | 8,991 | 88,234 | 168,083 | |
In Work Force | 5,859 | 54,857 | 104,925 | |
Not In Work Force | 3,132 | 33,377 | 63,158 | |
Workforce Employed | 5,538 | 50,827 | 98,188 | |
Workforce Unemployed | 312 | 3,984 | 6,654 | |
Civlian Workforce | 5,850 | 54,810 | 104,842 | |
Military Workforce | 9 | 47 | 83 | |
Total Households | 4,371 | 40,133 | 76,291 | |
Family Households | 2,048 | 24,061 | 48,727 | |
Non-Family Households | 2,323 | 16,073 | 27,565 | |
Married Couple | 1,274 | 16,062 | 34,427 | |
Other Family | 775 | 7,998 | 14,300 | |
Married w/Child | 584 | 7,057 | 14,365 | |
Single Male w/Child | 142 | 1,278 | 1,904 | |
Single Female w/Child | 256 | 3,265 | 5,683 |
Population Change Last Two Decades - Plus Projection
2000 | % | 2010 | % | 2020 | % | 2030 | |
---|---|---|---|---|---|---|---|
Oregon | 3,421,399 | +12 | 3,831,074 | +11 | 4,264,810 | +11 | 4,727,438 |
Marion County | 284,834 | +11 | 315,335 | +11 | 350,125 | +11 | 388,420 |
Polk County | 62,380 | +21 | 75,403 | +13 | 85,012 | +16 | 98,501 |
Total Working Age Population:
Total Households:
Total Working Age Population:
Total Households:
Total Working Age Population:
Total Households: