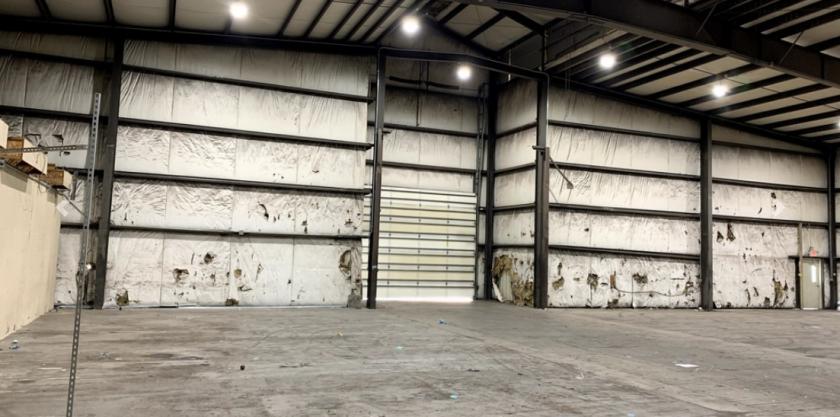
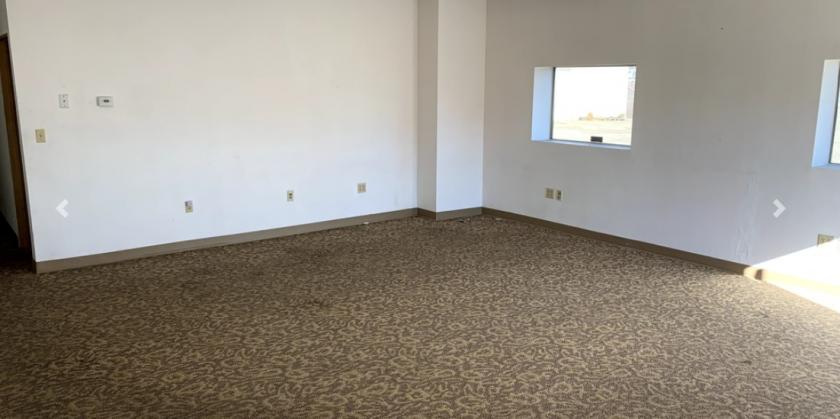
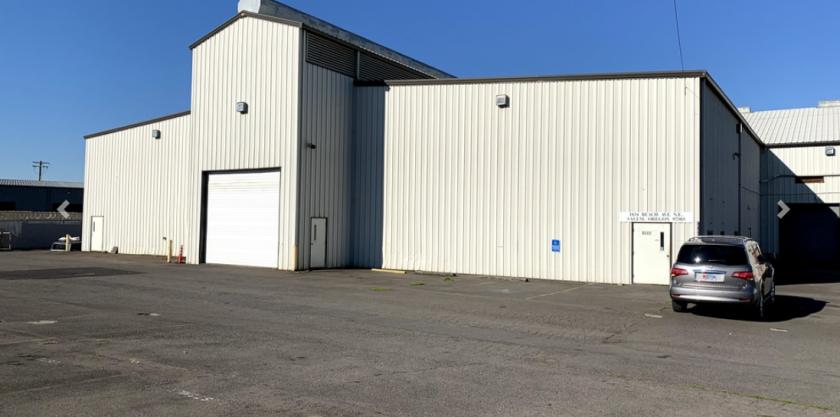
1-Mile | 3-Miles | 5-Miles | ||
---|---|---|---|---|
Total Population | 14,419 | 127,788 | 204,869 | |
Population Median Age | 34 | 36 | 37 | |
Population by Age | 0-9 Yrs | 1989 (13%) | 17622 (13%) | 27176 (13%) |
10-19 Yrs | 2400 (16%) | 18308 (14%) | 28585 (13%) | |
20-29 Yrs | 2413 (16%) | 21094 (16%) | 31450 (15%) | |
30-39 Yrs | 2086 (14%) | 18153 (14%) | 28668 (13%) | |
40-49 Yrs | 1769 (12%) | 15492 (12%) | 25014 (12%) | |
50-59 Yrs | 1689 (11%) | 14143 (11%) | 22988 (11%) | |
60-69 Yrs | 1393 (9%) | 12703 (9%) | 22377 (10%) | |
70+ Yrs | 680 (4%) | 10273 (8%) | 18612 (9%) | |
Median HH Income | $42,516 | $48,970 | $55,285 | |
Total Household Income | < 24K | 1205 (25%) | 10475 (23%) | 14629 (20%) |
25-49K | 1557 (32%) | 12025 (27%) | 18351 (25%) | |
50-74K | 865 (18%) | 9054 (20%) | 14702 (20%) | |
75-99K | 518 (10%) | 5404 (12%) | 9779 (13%) | |
100-199K | 542 (11%) | 6287 (14%) | 13173 (18%) | |
200K+ | 49 (1%) | 740 (1%) | 2120 (2%) | |
Highest Education Level | No Diploma | 2415 | 15315 | 21003 |
Diploma or GED | 2458 | 22596 | 34316 | |
Some College | 2203 | 21978 | 36021 | |
Assoc. Degree | 696 | 6721 | 11343 | |
Bachelors Degree | 718 | 9657 | 19675 | |
Higher Degree | 429 | 4827 | 10998 | |
Total Housing Units | 5,160 | 47,061 | 77,627 | |
--Owner-Occupied | 2,012 | 20,657 | 38,811 | |
--Renter-Occupied | 2,724 | 23,328 | 33,943 | |
Owner-Occupied Values | < 100K | 145 | 2031 | 3587 |
100-199K | 1107 | 7753 | 11164 | |
200-299K | 662 | 8303 | 14870 | |
300-399K | 9 | 1776 | 6116 | |
400-499K | 29 | 404 | 1778 | |
500K+ | 59 | 391 | 1296 | |
Total Working Age Population | 10,977 | 99,654 | 160,844 | |
In Work Force | 7,028 | 61,513 | 100,532 | |
Not In Work Force | 3,949 | 38,141 | 60,312 | |
Workforce Employed | 6,459 | 57,194 | 94,038 | |
Workforce Unemployed | 568 | 4,287 | 6,416 | |
Civlian Workforce | 7,028 | 61,481 | 100,454 | |
Military Workforce | 0 | 32 | 78 | |
Total Households | 4,736 | 43,985 | 72,754 | |
Family Households | 2,995 | 27,253 | 46,405 | |
Non-Family Households | 1,741 | 16,732 | 26,349 | |
Married Couple | 1,928 | 18,016 | 32,645 | |
Other Family | 1,067 | 9,238 | 13,760 | |
Married w/Child | 974 | 8,192 | 13,765 | |
Single Male w/Child | 219 | 1,294 | 1,872 | |
Single Female w/Child | 428 | 3,862 | 5,378 |
Population Change Last Two Decades - Plus Projection
2000 | % | 2010 | % | 2020 | % | 2030 | |
---|---|---|---|---|---|---|---|
Oregon | 3,421,399 | +12 | 3,831,074 | +11 | 4,264,810 | +11 | 4,727,438 |
Marion County | 284,834 | +11 | 315,335 | +11 | 350,125 | +11 | 388,420 |
Polk County | 62,380 | +21 | 75,403 | +13 | 85,012 | +16 | 98,501 |
Total Working Age Population:
Total Households:
Total Working Age Population:
Total Households:
Total Working Age Population:
Total Households: