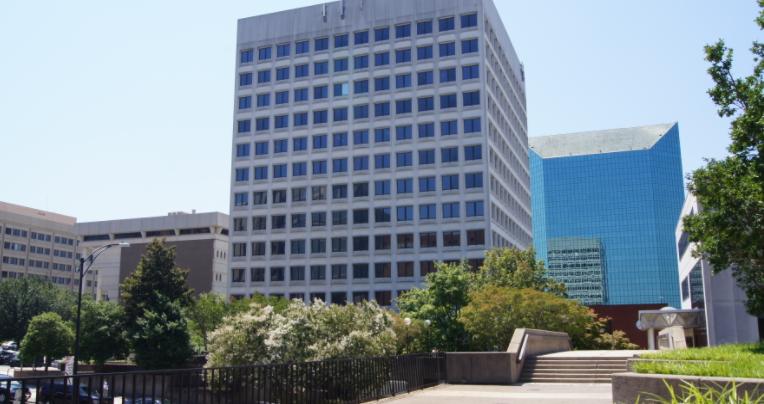
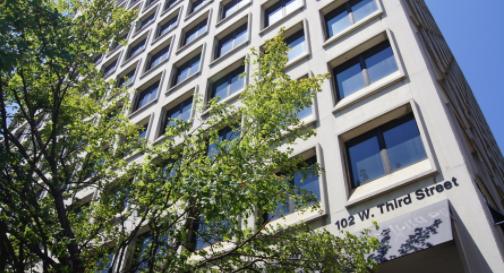
1-Mile | 3-Miles | 5-Miles | ||
---|---|---|---|---|
Total Population | 11,372 | 70,569 | 156,860 | |
Population Median Age | 34 | 36 | 36 | |
Population by Age | 0-9 Yrs | 1105 (9%) | 9386 (13%) | 21536 (13%) |
10-19 Yrs | 1491 (13%) | 11115 (15%) | 22709 (14%) | |
20-29 Yrs | 3294 (28%) | 12220 (17%) | 26476 (16%) | |
30-39 Yrs | 1673 (14%) | 9021 (12%) | 19850 (12%) | |
40-49 Yrs | 988 (8%) | 7579 (10%) | 17081 (10%) | |
50-59 Yrs | 1286 (11%) | 8601 (12%) | 19156 (12%) | |
60-69 Yrs | 778 (6%) | 6722 (9%) | 15500 (9%) | |
70+ Yrs | 757 (6%) | 5924 (8%) | 14553 (9%) | |
Median HH Income | $35,925 | $33,961 | $39,353 | |
Total Household Income | < 24K | 1694 (36%) | 10697 (39%) | 20298 (33%) |
25-49K | 1116 (24%) | 6441 (23%) | 16046 (26%) | |
50-74K | 802 (17%) | 3758 (13%) | 9822 (16%) | |
75-99K | 197 (4%) | 1759 (6%) | 5319 (8%) | |
100-199K | 579 (12%) | 3010 (11%) | 6762 (11%) | |
200K+ | 248 (5%) | 1509 (5%) | 2787 (4%) | |
Highest Education Level | No Diploma | 862 | 6637 | 13443 |
Diploma or GED | 1747 | 11781 | 25963 | |
Some College | 1191 | 8733 | 20825 | |
Assoc. Degree | 343 | 2452 | 6653 | |
Bachelors Degree | 1686 | 7723 | 18696 | |
Higher Degree | 1264 | 6543 | 13139 | |
Total Housing Units | 5,690 | 32,538 | 70,941 | |
--Owner-Occupied | 927 | 11,150 | 28,767 | |
--Renter-Occupied | 3,709 | 16,023 | 32,268 | |
Owner-Occupied Values | < 100K | 171 | 4053 | 9749 |
100-199K | 209 | 3146 | 10983 | |
200-299K | 187 | 1525 | 3469 | |
300-399K | 148 | 755 | 1736 | |
400-499K | 137 | 451 | 875 | |
500K+ | 74 | 1220 | 1955 | |
Total Working Age Population | 10,001 | 56,098 | 123,623 | |
In Work Force | 5,252 | 30,903 | 71,386 | |
Not In Work Force | 4,749 | 25,194 | 52,236 | |
Workforce Employed | 4,856 | 28,388 | 66,432 | |
Workforce Unemployed | 396 | 2,447 | 4,747 | |
Civlian Workforce | 5,252 | 30,834 | 71,179 | |
Military Workforce | 0 | 69 | 208 | |
Total Households | 4,636 | 27,173 | 61,035 | |
Family Households | 1,511 | 13,966 | 33,307 | |
Non-Family Households | 3,124 | 13,207 | 27,728 | |
Married Couple | 866 | 7,698 | 19,909 | |
Other Family | 646 | 6,268 | 13,398 | |
Married w/Child | 284 | 3,038 | 7,705 | |
Single Male w/Child | 97 | 726 | 1,658 | |
Single Female w/Child | 280 | 2,899 | 6,011 |
Population Change Last Two Decades - Plus Projection
2000 | % | 2010 | % | 2020 | % | 2030 | |
---|---|---|---|---|---|---|---|
North Carolina | 8,049,313 | +18 | 9,535,483 | +11 | 10,630,691 | +11 | 11,836,070 |
Forsyth County | 306,067 | +15 | 350,670 | +9 | 383,123 | +9 | 418,257 |
Total Working Age Population:
Total Households:
Total Working Age Population:
Total Households:
Total Working Age Population:
Total Households: