Location
Located in downtown Beaverton with 75' frontage on SW Farmington Road.
Description
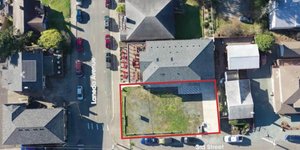
Re-development opportunity in downtown Beaverton. The lots are highly visible with 75' frontage on SW Farmington Road.
12680 SW Farmington Road (Tax Lot 800) - 105' x 25'
Building Specs:
- 2,400 SF on two stories
- Current tenant is on a month-to-month paying $1600.00 per month – gross
- Excellent exposure and off-street parking
12675 SW First Ave (Tax Lot 900) - 200' x 500
Building Specs:
- 2,768 SF – Can be divided into two spaces
- Multiple entries
- (2) Restrooms
- New roof – complete tear off 2016
- Off-street parking in front of the building
- Good signage
Highlights
Traffic count on SW Farmington Road: 34,424 cars per day
The RC-OT District encompasses the City of Beaverton's original downtown, and is intended to maintain the mix of uses
Real Estate Taxes: $8,259.95 for both parcels
No part of this information may be copied, reproduced, repurposed, or screen-captured for any commercial purpose without prior written authorization from MyEListing.
While we strive to provide the most accurate information, all listing information, and demographic data, is provided by third-parties. As such, MyEListing will not be responsible for the accuracy of the information. It is strongly recommended that you verify all information with the listing agent, and any relevant agencies, prior to making any decisions.
What is the asking price for 12675 Southwest 1st Street in Beaverton?
The asking price for 12675 Southwest 1st Street is $1,499,000
What is the building size of this Retail property in Beaverton, OR?
The size of the building/unit at 12675 Southwest 1st Street in Beaverton is 2,768 square feet
How much land does the Beaverton, OR property at 12675 Southwest 1st Street include?
12675 Southwest 1st Street in Beaverton includes 0.290 acres of land
What kind of Retail is the propery at 12675 Southwest 1st Street?
The property at 12675 Southwest 1st Street Beaverton, OR 97005 is listed as a Other Retail Retail property
What is the population within 1 mile of 12675 Southwest 1st Street in Beaverton?
The population within 1 mile of 12675 Southwest 1st Street Beaverton, OR 97005 is 19,291 people.
Who do I contact for questions about 12675 Southwest 1st Street?
You should contact the listing agent,
Brett Bayne, for any details regarding this commercial listing.