Specialty Real Estate
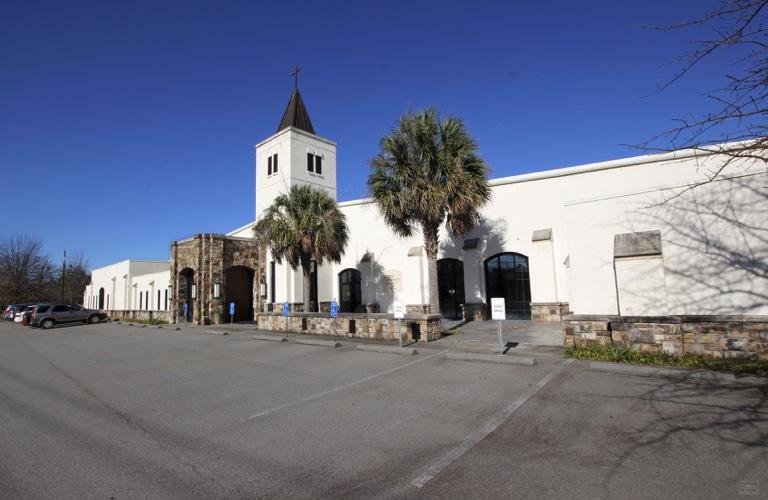
1824 Barnwell Street Columbia, SC 29201
1824 Barnwell Street Columbia, SC 29201
Details & Description
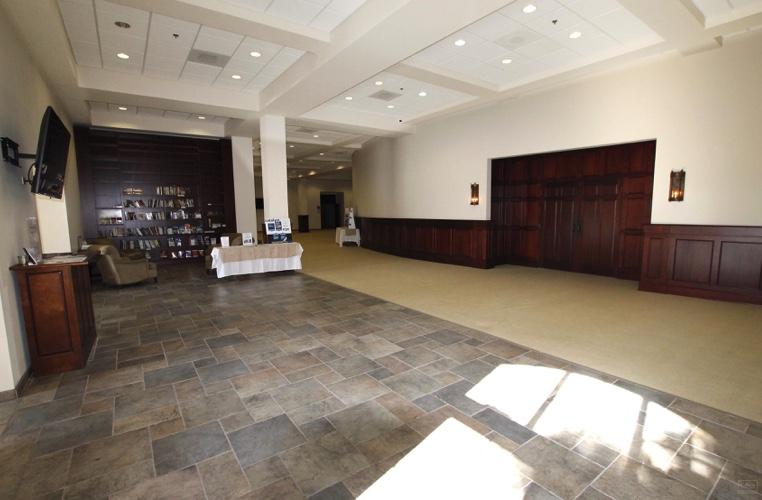
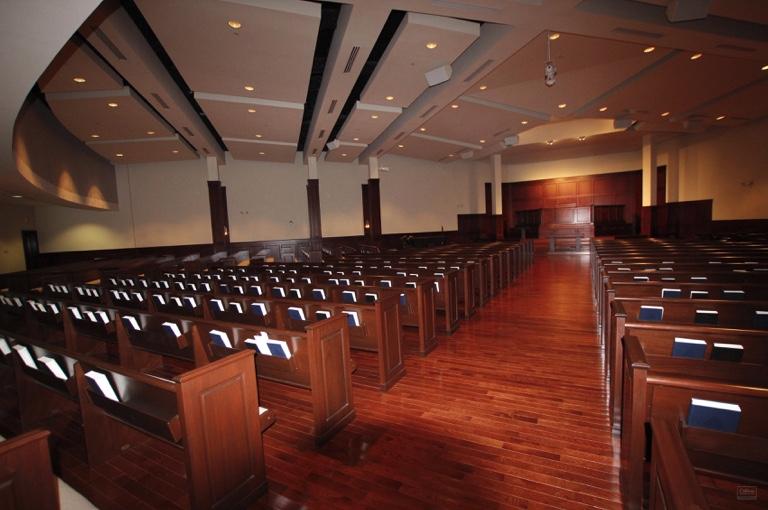
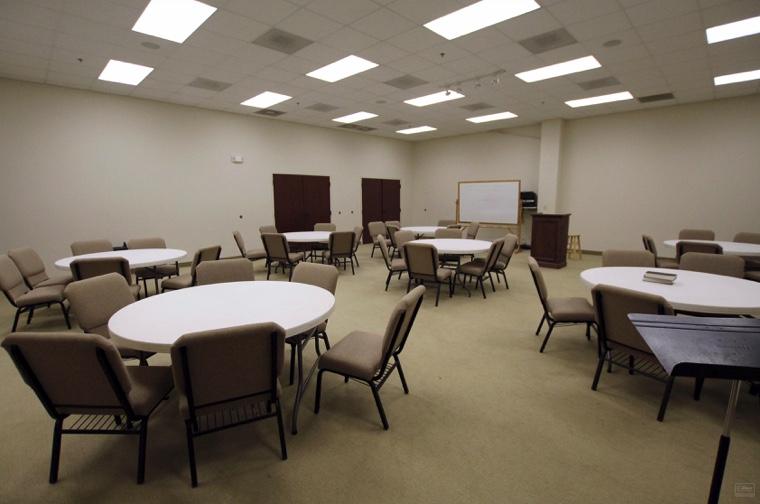
Additional Photos

Listing Agents

Allen Wilkerson
O: 803-401-4210
allen.wilkerson@colliers.com
O: 803-401-4210
allen.wilkerson@colliers.com
While we strive to provide the most accurate information, all listing information, and demographic data, is provided by third-parties. As such, MyEListing will not be responsible for the accuracy of the information. It is strongly recommended that you verify all information with the listing agent, and any relevant agencies, prior to making any decisions.


