Description
An extremely rare opportunity to acquire a 25.0 acre, income-producing site with diverse cash flow stream in Conshohocken, PA.
Avison Young has been retained as the exclusive representative for the sale of Ashford Farm (the Property), an existing equestrian facility set on a bucolic 25 acres within the Conshohocken Miquon area. Ashford Farm is a one-of-a-kind investment facility offering horse boarding, riding lessons, and popular summer horse camp.
This spectacular property offers a rare blend of countryside set amidst the bustling surroundings of the country’s seventh largest metropolitan area. Set on three breathtaking parcels, totaling 25 acres with sweeping views of the of the Schuylkill River, Philadelphia skyline, and countryside at every turn, Ashford Farm offers complete privacy, yet is located within minutes of renowned schools, Center City Philadelphia, The opulence of Chestnut Hill, Philadelphia and more. Rarely does a property this exceptional become available featuring stunning location, incredible views, and equestrian lifestyle. Also included in this property is a fully updated residence which seamlessly combines carefully designed formal living spaces with warm, every day functionality and an easy open flow.
Ashford Farm is family owned and operated since 1972. Located in Conshohocken, Pennsylvania, Ashford Farm is nestled high above the Schuylkill River with 25 acres of scenic rolling hills. Ashford Farm is located at the confluence of Philadelphia, Chestnut Hill, and the Main Line. The facility currently operates as a horse farm, riding facility and summer day camp. Ashford Farm has over 50 horses located on site, while the existing and historic cash flow is substantial, income can be increased by increasing the number of boarders, adding a covered riding ring, and increasing the number of summer campers.
Highlights
Opportunity to Purchase: The property offers the potential to purchase the existing improvements with the existing equestrian facility and boarding business. Business financials are available upon request.
Over 25 Usable Acres with PECO Easement: The property includes an easement under PECO electric lines providing an additional 13+ acres of usable area. Details of the PECO easement are available upon request.
Flexible Spaces: Equestrian space within the Greater Philadelphia region is limited and in great demand. The property has additional 2,610 sf farm house that has been completely renovated, that will earn $3,500/month if leased, one (1) studio apartment, offices, storage barns, outdoor riding rings, and stables for 50+ horses.
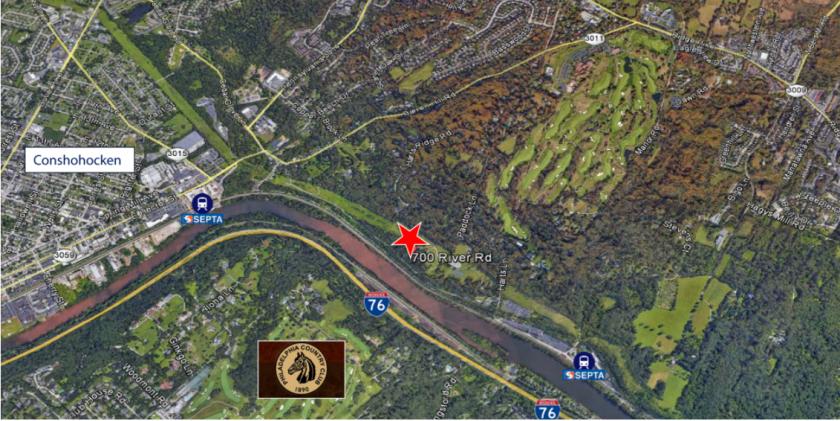
Excellent Location Along the I-76: The property is situated in the well-regarded Colonial School District. It is less than three miles from I-476 and I-76 interchange. It has great access points to I-76 and I-476.
Rail/Train Access: .7 miles to Miquon train Station, 1.3 miles to Spring Mill train station all of the region’s commercial and residential destinations – Center City, the Main Line, King of Prussia, New Jersey and Philadelphia International Airport – are minutes away.
High Demographic Surroundings: The property is located in Whitemarsh Township, Montgomery County, Pennsylvania. Whitemarsh Township has a median household income of $102,007 which is one of the highest in Pennsylvania.
Excellent School System with Limited Competition: The land has enduring value resulting from Whitemarsh’s school district,
and will benefit from Whitemarsh’s status as the 24th best school system in the state as rated by US News and World Report.
Amenity Base: The property is within a quarter mile to a surplus of amenities, Philadelphia Country Club, Green Valley Country Club, The Miquon School, LA Fitness, Ace Golf Club, and Starbucks. It’s convenient access rail points to major highways, highly rated school system, and locale to shopping.