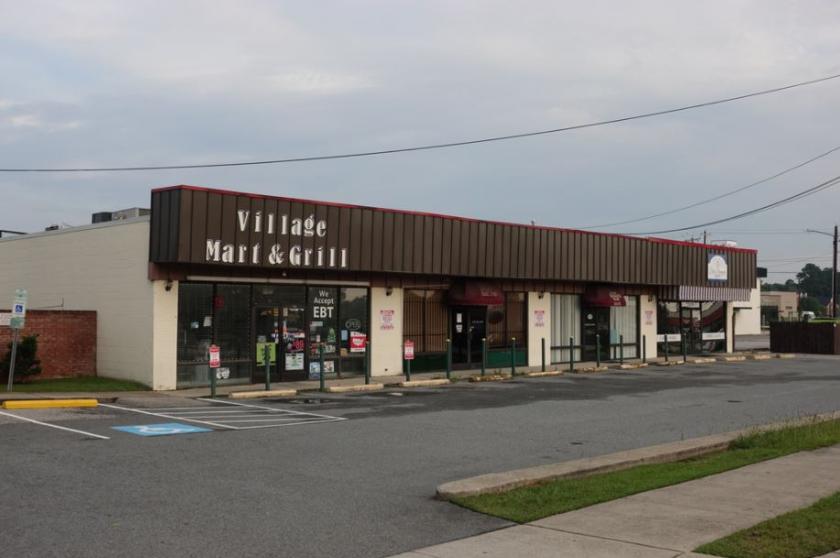
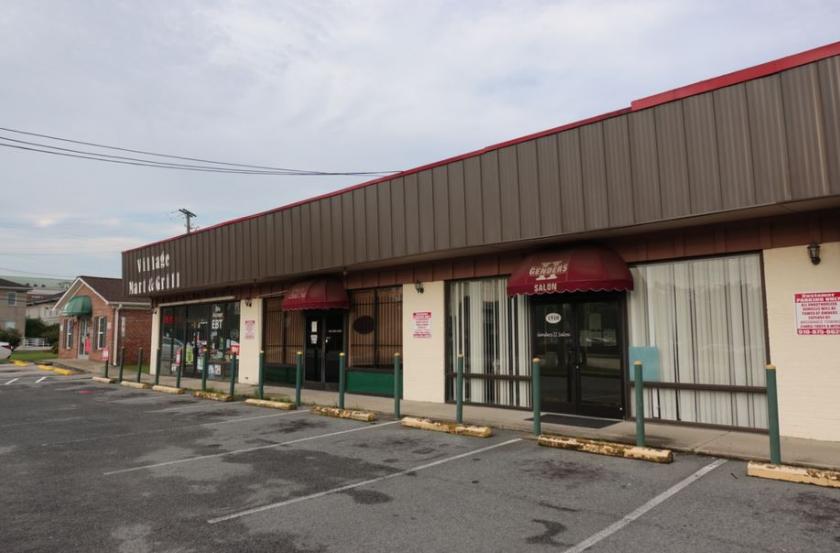
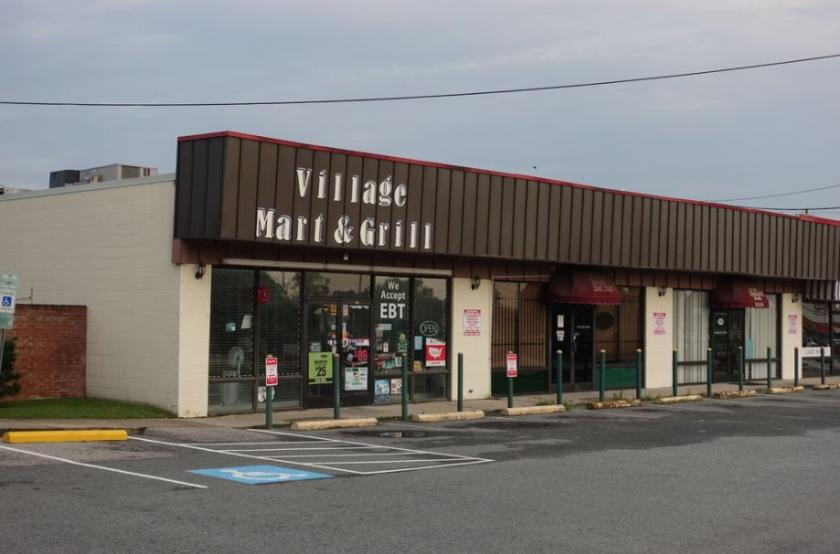
1510-1518 Purdue Dr. consists of three units in a 4-unit strip center located adjacent to Raeford Rd./BUS 401 in the Southwest Fayetteville submarket. Located north across Raeford Rd./BUS 401 is the Highland Shopping Center (.08 mile away), one of the busiest high-end neighborhood shopping centers in Fayetteville. National retailers in the shopping center include Harris Teeter, GNC, Stein Mart, Hallmark, Panera Bread and Starbucks. Tallywood Shopping Center is located 1/3 mile to the west with national retailers that include Publix and Great Clips. Highland Country Club is located less than 1/2 mile to the east. The onramp to the All-American Expressway is 3/4 mile to the west.The property is in good condition with numerous substantial repairs/upgrades made in the last ten (10) years. Parking is available in the front and the back of the building (via easement). The capitalization rate for the property is 5.34% (at $9.36 rent per sq. ft.), with a realistic three (3) year pro-forma capitalization rate of 7.49% (at $12.55 rent per sq. ft.), which will begin to occur in January 2021 when the first current lease expires. Additional opportunities to increase investment return include: (1) instituting net leasing (N to NNN) and/or (2) subdividing the current three (3) units into six (6) units to substantially increase the proposed proforma capitalization rate of 7.49%. In fact, the owner of the fourth unit (1506 Purdue Dr.) subdivided the unit and is renting each subdivided space for $1,450 per month ($18.19 rent per sq. ft.). For purposes of redevelopment, the property is zoned Community Commercial (CC)and could accommodate a diverse range of medium to high intensity retail, service and office uses that serve the general community and region. 1510-1518 Purdue Dr. is an versatile and considerably untapped investment opportunity.