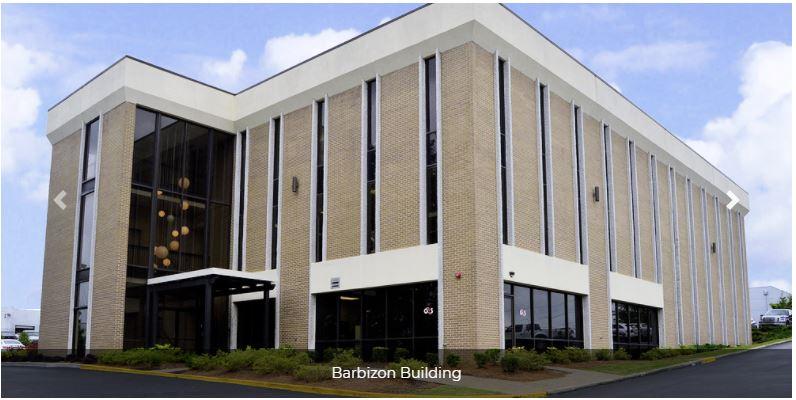
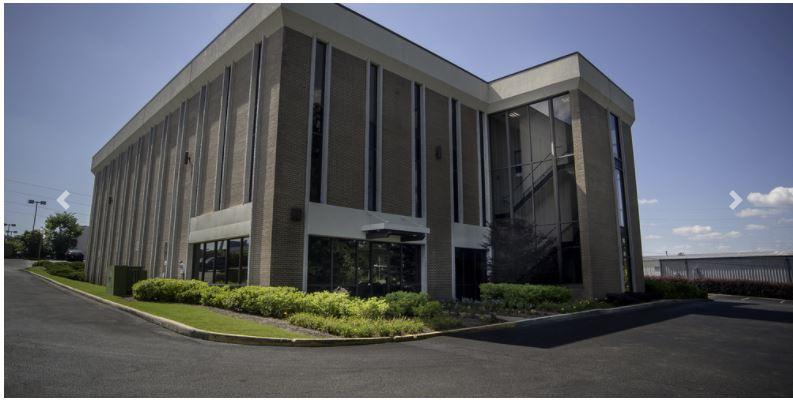
Office Space
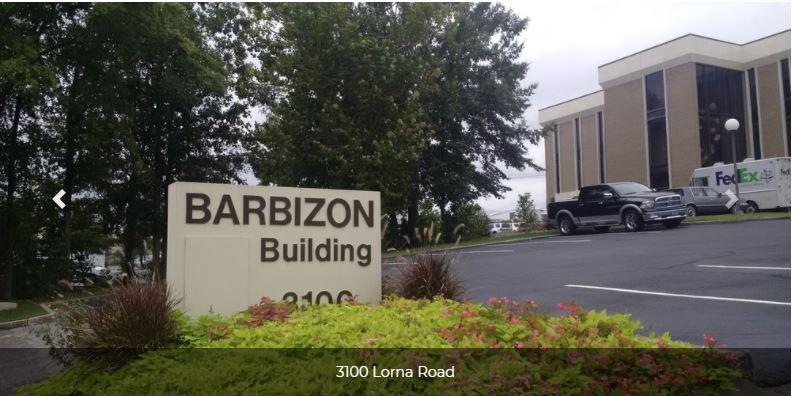
3100 Lorna Road Hoover, AL 35216
3100 Lorna Road Hoover, AL 35216
Details & Description
Property Highlights
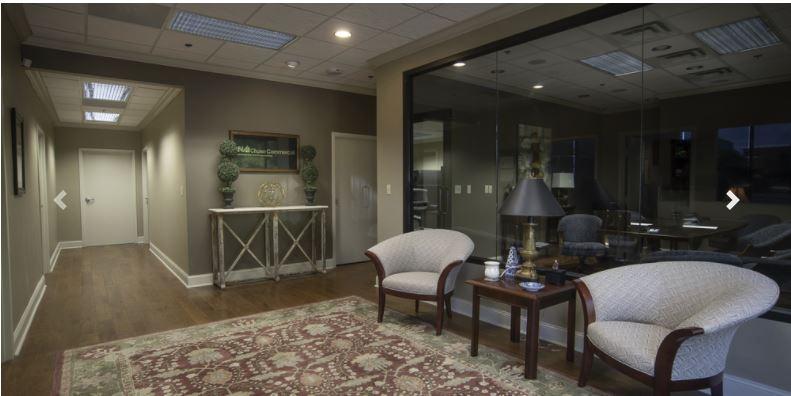
- • Newly remodeled building
- • Convenient access to Hover business
- • High speed internet access available
- • Minutes from Riverchase Galleria
- • Onsite property management
Additional Photos

Listing Agents

Michael Romano
NAI Chase Commercial
O: 205-201-7307
M: 205-222-1909
romanom@chasecommercial.com
NAI Chase Commercial
O: 205-201-7307
M: 205-222-1909
romanom@chasecommercial.com
While we strive to provide the most accurate information, all listing information, and demographic data, is provided by third-parties. As such, MyEListing will not be responsible for the accuracy of the information. It is strongly recommended that you verify all information with the listing agent, and any relevant agencies, prior to making any decisions.


