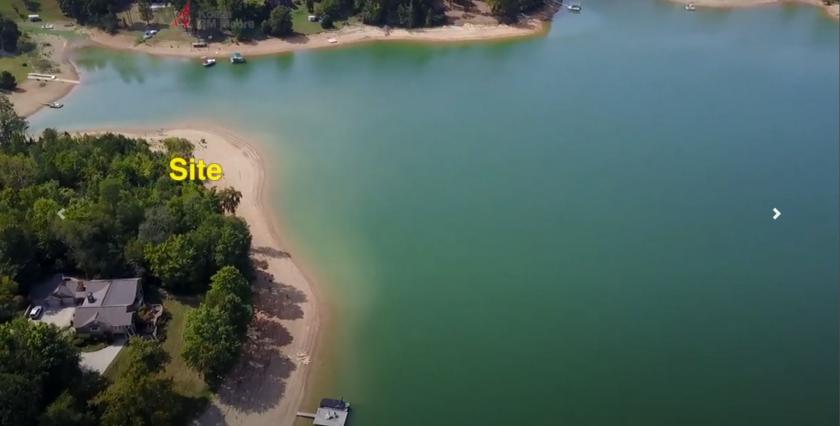
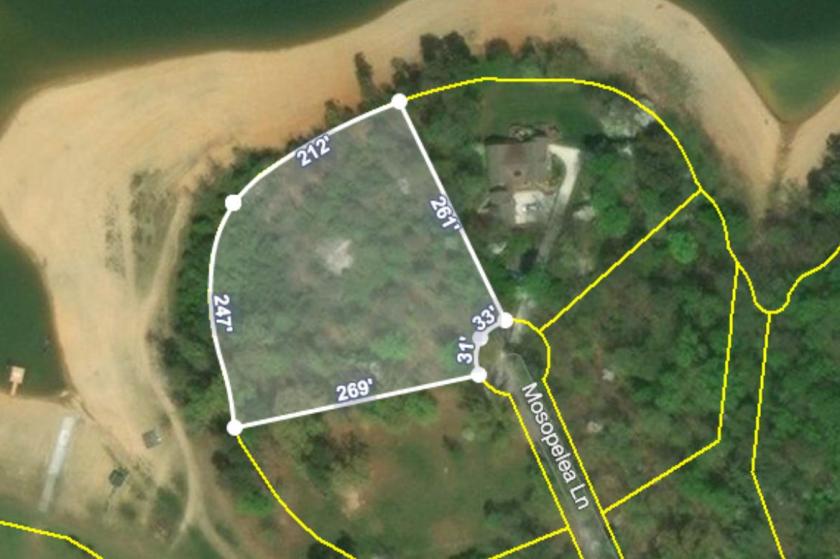
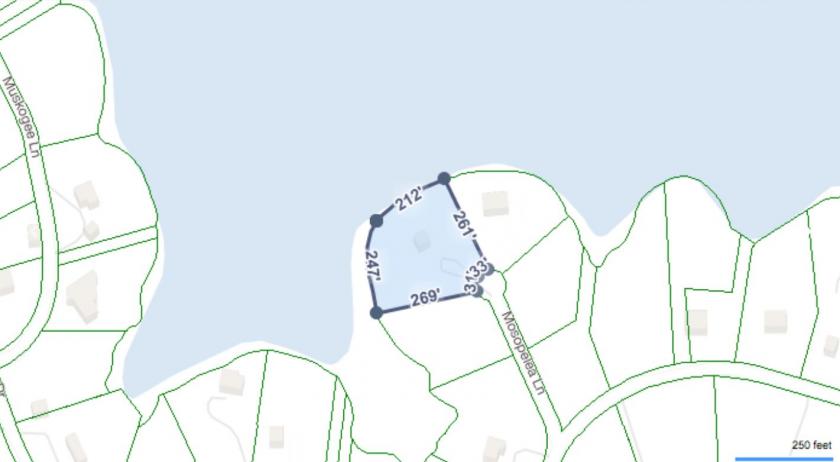
1-Mile | 3-Miles | 5-Miles | ||
---|---|---|---|---|
Total Population | 419 | 3,724 | 14,470 | |
Population Median Age | 44 | 44 | 43 | |
Population by Age | 0-9 Yrs | 27 (6%) | 329 (8%) | 1580 (10%) |
10-19 Yrs | 47 (11%) | 364 (9%) | 1497 (10%) | |
20-29 Yrs | 60 (14%) | 514 (13%) | 1848 (12%) | |
30-39 Yrs | 36 (8%) | 353 (9%) | 1500 (10%) | |
40-49 Yrs | 50 (11%) | 425 (11%) | 1646 (11%) | |
50-59 Yrs | 68 (16%) | 527 (14%) | 2165 (14%) | |
60-69 Yrs | 76 (18%) | 716 (19%) | 2257 (15%) | |
70+ Yrs | 54 (12%) | 496 (13%) | 1977 (13%) | |
Median HH Income | $46,535 | $45,788 | $45,776 | |
Total Household Income | < 24K | 36 (21%) | 357 (23%) | 1483 (26%) |
25-49K | 55 (33%) | 497 (33%) | 1596 (28%) | |
50-74K | 45 (27%) | 378 (25%) | 1249 (22%) | |
75-99K | 14 (8%) | 159 (10%) | 748 (13%) | |
100-199K | 12 (7%) | 92 (6%) | 490 (8%) | |
200K+ | 3 (1%) | 23 (1%) | 81 (1%) | |
Highest Education Level | No Diploma | 61 | 522 | 1992 |
Diploma or GED | 148 | 1283 | 4576 | |
Some College | 51 | 470 | 1600 | |
Assoc. Degree | 24 | 209 | 746 | |
Bachelors Degree | 22 | 194 | 993 | |
Higher Degree | 11 | 108 | 505 | |
Total Housing Units | 241 | 1,993 | 6,978 | |
--Owner-Occupied | 131 | 1,218 | 4,216 | |
--Renter-Occupied | 34 | 288 | 1,431 | |
Owner-Occupied Values | < 100K | 44 | 454 | 1538 |
100-199K | 57 | 535 | 1856 | |
200-299K | 18 | 123 | 482 | |
300-399K | 8 | 66 | 223 | |
400-499K | 3 | 16 | 56 | |
500K+ | 2 | 25 | 62 | |
Total Working Age Population | 354 | 3,133 | 11,935 | |
In Work Force | 195 | 1,666 | 6,379 | |
Not In Work Force | 159 | 1,467 | 5,557 | |
Workforce Employed | 174 | 1,466 | 5,905 | |
Workforce Unemployed | 21 | 200 | 473 | |
Civlian Workforce | 195 | 1,666 | 6,379 | |
Military Workforce | 0 | 0 | 0 | |
Total Households | 165 | 1,506 | 5,647 | |
Family Households | 126 | 1,101 | 4,074 | |
Non-Family Households | 39 | 405 | 1,573 | |
Married Couple | 100 | 853 | 3,222 | |
Other Family | 26 | 248 | 852 | |
Married w/Child | 14 | 112 | 731 | |
Single Male w/Child | 1 | 14 | 151 | |
Single Female w/Child | 6 | 84 | 269 |
Population Change Last Two Decades - Plus Projection
2000 | % | 2010 | % | 2020 | % | 2030 | |
---|---|---|---|---|---|---|---|
Tennessee | 5,689,283 | +12 | 6,346,105 | +9 | 6,886,369 | +7 | 7,393,069 |
Hawkins County | 53,563 | +6 | 56,833 | 0 | 56,615 | -1 | 55,948 |
Grainger County | 20,659 | +10 | 22,657 | +3 | 23,388 | +3 | 24,069 |
Hamblen County | 58,128 | +8 | 62,544 | +4 | 65,234 | +4 | 68,146 |
Total Working Age Population:
Total Households:
Total Working Age Population:
Total Households:
Total Working Age Population:
Total Households: