Industrial Properties
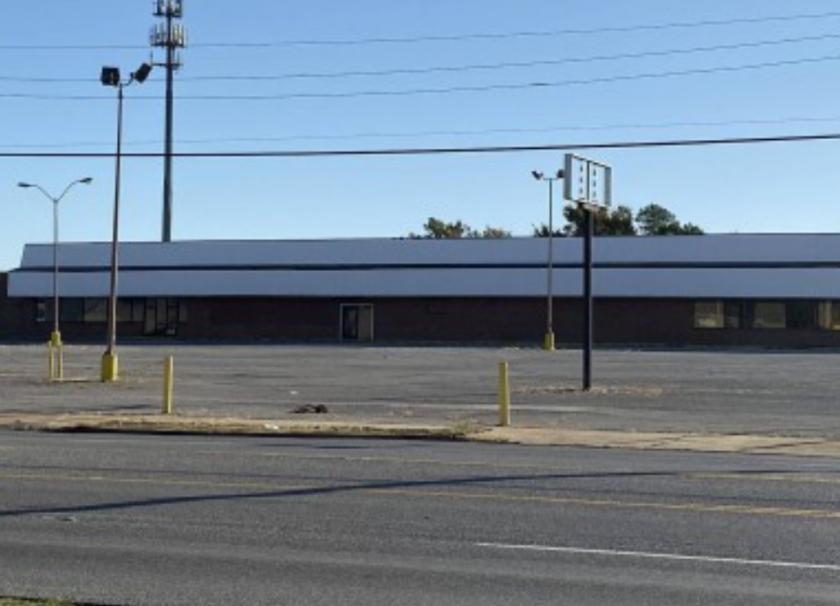
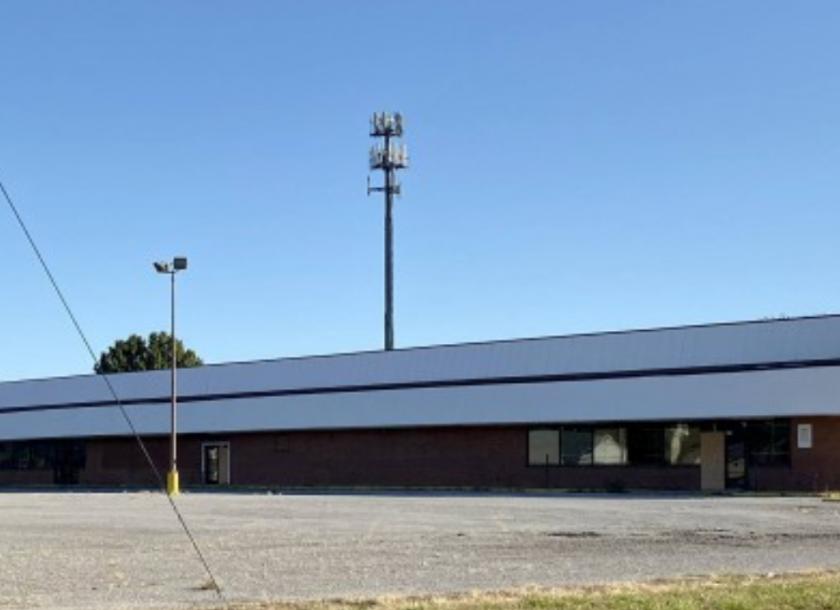
4600 Millbranch Road Memphis, TN 38116
4600 Millbranch Road Memphis, TN 38116
Details & Description
Listing Agents

Gary Myers
Myers Commercial Real Estate
O: 901-761-5595
info@myerscre.com
Myers Commercial Real Estate
O: 901-761-5595
info@myerscre.com
While we strive to provide the most accurate information, all listing information, and demographic data, is provided by third-parties. As such, MyEListing will not be responsible for the accuracy of the information. It is strongly recommended that you verify all information with the listing agent, and any relevant agencies, prior to making any decisions.