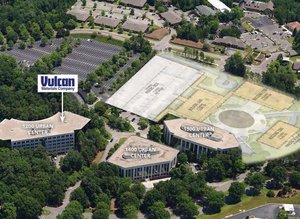
1-Mile | 3-Miles | 5-Miles | ||
---|---|---|---|---|
Total Population | 3,786 | 40,265 | 103,619 | |
Population Median Age | 37 | 39 | 39 | |
Population by Age | 0-9 Yrs | 310 (8%) | 4565 (11%) | 12632 (12%) |
10-19 Yrs | 152 (4%) | 3787 (9%) | 13812 (13%) | |
20-29 Yrs | 1235 (32%) | 7096 (17%) | 13708 (13%) | |
30-39 Yrs | 618 (16%) | 5669 (14%) | 12856 (12%) | |
40-49 Yrs | 336 (8%) | 4761 (11%) | 13315 (12%) | |
50-59 Yrs | 552 (14%) | 5557 (13%) | 13686 (13%) | |
60-69 Yrs | 284 (7%) | 4716 (11%) | 12440 (12%) | |
70+ Yrs | 298 (7%) | 4114 (10%) | 11169 (10%) | |
Median HH Income | $64,348 | $78,381 | $93,322 | |
Total Household Income | < 24K | 284 (13%) | 2192 (12%) | 4491 (10%) |
25-49K | 479 (23%) | 2961 (16%) | 5973 (14%) | |
50-74K | 463 (22%) | 3405 (19%) | 6300 (15%) | |
75-99K | 396 (19%) | 2551 (14%) | 5107 (12%) | |
100-199K | 316 (15%) | 4412 (24%) | 11642 (28%) | |
200K+ | 125 (6%) | 2286 (12%) | 7502 (18%) | |
Highest Education Level | No Diploma | 60 | 721 | 1676 |
Diploma or GED | 313 | 2570 | 6596 | |
Some College | 535 | 5600 | 12154 | |
Assoc. Degree | 102 | 1939 | 3711 | |
Bachelors Degree | 1191 | 11274 | 27515 | |
Higher Degree | 719 | 6997 | 19517 | |
Total Housing Units | 2,607 | 20,416 | 45,446 | |
--Owner-Occupied | 501 | 9,964 | 29,058 | |
--Renter-Occupied | 1,562 | 7,844 | 11,957 | |
Owner-Occupied Values | < 100K | 13 | 251 | 927 |
100-199K | 80 | 1179 | 3274 | |
200-299K | 165 | 2363 | 6276 | |
300-399K | 160 | 2905 | 6801 | |
400-499K | 42 | 1491 | 4303 | |
500K+ | 41 | 1774 | 7477 | |
Total Working Age Population | 3,385 | 33,343 | 82,891 | |
In Work Force | 2,575 | 23,313 | 55,515 | |
Not In Work Force | 810 | 10,029 | 27,376 | |
Workforce Employed | 2,433 | 22,297 | 53,310 | |
Workforce Unemployed | 126 | 969 | 2,123 | |
Civlian Workforce | 2,559 | 23,266 | 55,434 | |
Military Workforce | 16 | 47 | 81 | |
Total Households | 2,063 | 17,808 | 41,015 | |
Family Households | 886 | 10,345 | 27,653 | |
Non-Family Households | 1,177 | 7,463 | 13,362 | |
Married Couple | 723 | 8,835 | 23,966 | |
Other Family | 164 | 1,510 | 3,688 | |
Married w/Child | 164 | 3,252 | 10,080 | |
Single Male w/Child | 55 | 279 | 554 | |
Single Female w/Child | 46 | 516 | 1,375 |
Population Change Last Two Decades - Plus Projection
2000 | % | 2010 | % | 2020 | % | 2030 | |
---|---|---|---|---|---|---|---|
Alabama | 4,447,100 | +7 | 4,779,736 | +3 | 4,940,253 | +4 | 5,124,380 |
Shelby County | 143,293 | +36 | 195,085 | +15 | 224,628 | +13 | 253,485 |
Jefferson County | 662,047 | -1 | 658,466 | +1 | 662,458 | 0 | 665,244 |
Total Working Age Population:
Total Households:
Total Working Age Population:
Total Households:
Total Working Age Population:
Total Households: